Finding Market Movement with The ADX (Average Directional Index) Financial Web
Post on: 16 Март, 2015 No Comment

The Average Directional Index (ADX ) of a financial instrument attempts to measure which trends in its price are noteworthy. Essentially, the goal of mapping the ADX is to determine if a change in price or activity is developing into a trend, or simply going to appear as a small blip in the overall structure of the instrument’s movement over time. The ADX uses the Directional Movement Indicators, one positive and one negative, in order to find a center-line trend of an asset price.
Directional Indicators
On any ADX map, there are two other lines; they are called the DI lines. One represents the positive DI, and one represents the negative DI. These indicators can be found with the same formula: 100 times the exponential moving average of (either the positive or the negative DM) divided by the Average True Range. In order to understand this formula, it is necessary to understand its parts.
Factors in DMI
The exponential moving average is a technical analysis of the movement of a financial instrument’s price. Instead of a simple moving average which gives the same weight to all price fluctuations, analysts use the exponential moving average because it gives more weight to the most recent price fluctuations.
A second factor in determining DI is Average True Range (ATR). ATR is a measure of the degree of volatility in a financial instrument based on its price fluctuations. It can be measured with the formula: the maximum previous close over a period of time minus the minimum previous close over a period of time. These two factors, exponential moving average and ATR are used to determine the Directional Movement Index.
Finding ADX
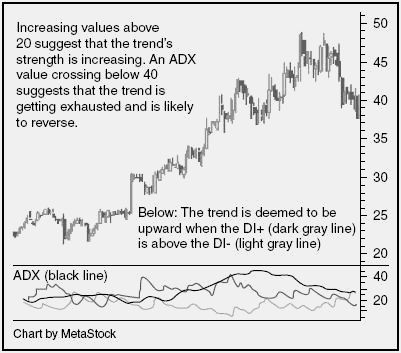
Once an analyst knows the +DI and the -DI, they can figure the ADI. When the line for +DI is consistently above the line for the -DI, the ADX is said to be moving in an upward trend. The important part of this movement is the degree of the movement. The two lines are then compared to generate the third line, the ADX, which is given a numerical value.
If the value is below 20, and the trend is upward, then the ADX would suggest the trend’s strength is increasing. If the ADX has moved above 40 but is now crossing back down, the trend is said to be nearing its expiration. As an investor, you will be provided information on the ADX of a financial instrument in many reports. By watching whether it is above or below 40, you can gain an idea of whether the trend is expected to continue.
Shortcomings of ADX
The key thing to remember is, just because a trend is expected to continue, it will not necessarily continue independent of all other factors. ADX only measures the value of a trend based on numerical terms, but is still subject to sudden fluctuations, due to changes in the underlying asset itself. On the whole, the trend of a financial instrument’s price will depend more on the perceived value of that instrument on the market, than on the financial indicators that make up ADX.
$7 Online Trading. Fast executions. Only at Scottrade


