Fibonacci Retracement Strategy •
Post on: 18 Июль, 2015 No Comment

Voting already done
Fibonacci has come along way and is widely known and used by financial traders around the globe. Fibonacci, better known as the Fibonacci Retracement. is a powerful tool in any trader’s arsenal. Some traders swear by this strategy and is seen as their bread and butter when it comes to trading. The Fibonacci tool is widely used by traders to form different strategies, and is famous for its use in pattern trading. Although this is a much more advance use for Fibonacci, it is just as effective when used as it was intended to be — identifying price reversals and retracements. You might be thinking where these magic Fibonacci numbers came from and what the exact history behind it is?
Fibonacci History Lesson
I know history is boring, but bare with me for a sec.
Leonardo Bonacci (c. 1170 – c. 1250) known as Fibonacci (Italian: [fiboˈnattʃi] ), and also Leonardo of Pisa, Leonardo Pisano, Leonardo Pisano Bigollo, Leonardo Fibonacci—was an Italianmathematician, considered as the most talented Western mathematician of the Middle Ages.
Fibonacci introduced to Europe the Hindu–Arabic numeral system primarily through his composition in 1202 of Liber Abaci (Book of Calculation ). He also introduced to Europe the sequence of Fibonacci numbers (discovered earlier in India but not previously known in Europe), which he used as an example in Liber Abaci .
Definition Of A Fibonacci Retracement
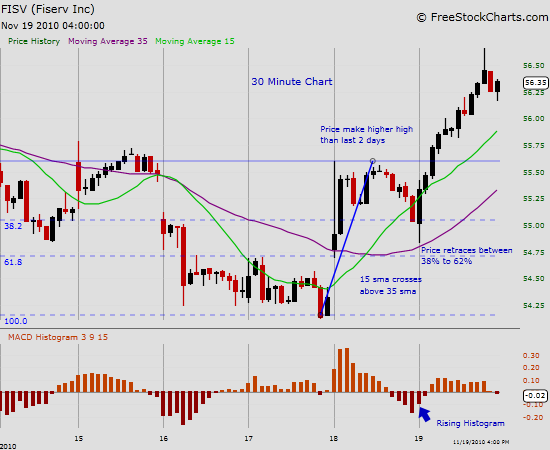
A Fibonacci retracement is a tool used for technical analysis that indicates potential support and resistance levels. A Fibonacci retracement indicates the potential retracement of an asset’s original directional price movement. These potential points are horizontal lines that indicate areas of support or resistance at key Fibonacci levels. Levels are created by using the Fibonacci Tool, drawing a trend line from point A, to point B (Swing High to Swing Low In A Downtrend/Swing Low to Swing High In A Uptrend). Key levels are the 23.6%, 38.2%, 50%, 61.8% & 100% retracements.
How To Draw A Fibonacci Retracement
In this example we will be using an uptrend to implement our Fibonacci retracement.
- Select your Fibonacci retracement tool (Standard with all popular charting software). Identify the trend direction. Mark the swing low & swing high. Start to draw your retracement from point A (Swing Low) to point B (Swing High).

Applying The Strategy To Binary Options
If you are familiar with any type of support and resistance strategy you will see a great deal of similarity. The Fibonacci numbers (23.6%, 38.2%, 50%, 61.8% & 100%) act as predefined support or resistance levels where we can expect price to pause, bounce, retrace or break through. In simple terms; we expect price to show some kind of reaction at these levels. When using this strategy for binary options trading we can take advantage at these levels.
During an uptrend retracement we can place call options, speculating that price will bounce off the support levels and continue in an upwards fashion. The opposite is true for a downtrend retracement. We would place put options when price reaches key resistance levels according to our Fibonacci retracement.
Fibonacci Retracement Summary
It is important to note that the 38.2%, 50% & 61.8% levels are the so called magic numbers, most often used by traders, thus getting the best reaction at these levels. It is recommended that this strategy is used with confluence in conjunction with other factors. All in all this is a very powerful strategy that can be used on almost any time frame. Use it with patience and you might just be surprised with the outcome.
Fibonacci Retracement Strategy Explained Reviewed by Allen H. on January 06. Rating: 3.6


