Fibonacci Day Trading Technique (7 Steps)
Post on: 16 Март, 2015 No Comment

Things You’ll Need
Day trading platform or technical analysis software program
The Fibonacci Trading Method: A Very Basic Primer
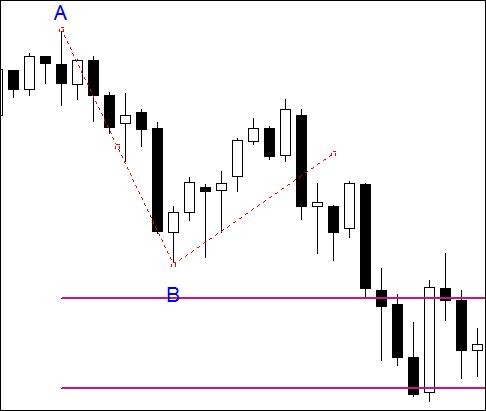
Lay out the numbers. The Fibonacci number sequence outlines an approximate 8:13 ratio between peaks and subsequent troughs, and predicts that the low following any high will run close to 38.2 percent off the peak, or 61.8 percent off the previous peak. Many traders also plot a third likely target for the low point at 50 percent from the high, though that figure isn’t a Fibonacci number.
The sequence also works to predict retracement levels in rising markets, as well.
Identify and plot Fibonacci retracement levels. If you have trading software, open your drawing or charting menu and look for the term Fibonacci. Different programs use different specific commands, but most day trading programs or automated trading platforms contain a menu of stock commands that will take stock prices and automatically graph Fibonacci retracement numbers directly on the graph for you.
Calculate the Fibonacci Retracement Levels using an online calculator. There are several of them available online. Simply enter the most recent high and most recent low and the calculator will provide you with the Fibonacci Retracement Levels in an instant.

For example, using a Fibonacci retracement calculator from TraderKnowledge.com you can input the most recent high and most recent low of a stock’s trading range. For a stock with a recent high of $100 and a low of $50, the Fibonacci retracement calculator returns likely price targets of $81, $75 and $69.
Calculate the Fibonacci Retracement Levels manually. It is relatively simple to do these calculations by hand. Remember you are calculating the percentage of the difference between a peak and trough, not the overall percentage gain or loss from the trough or peak.
For example, using a peak and a trough of $100 and $50, respectively, a 38.2 percent Fibonacci retracement level measured down from the peak is $81, not $61.8.
Watch for signs of a reversal as prices near these targets. If a decline stops or reverses, accompanied by an increase in volume as the price nears $81, that could indicate a buy signal. If not, the Fibonacci method predicts the next possible inflection point at $75 (50 percent of the gap between the $100 high and the $50 low) and the next one at $69, or at a decline of near 61.8 percent of the difference between the peak and trough.


