Chart patterns for beginners
Post on: 16 Март, 2015 No Comment

If simple is best, then its tough to argue against chart patterns. They dont require special software, a computer or even a calculator. All you need, at minimum, are a printed price chart and the knowledge of basic pattern construction. In some cases, its not even necessary to have an open-high-low-close bar chart. A line chart showing the close will work just fine.
There are two broad categories of chart patterns: reversal patterns and continuation patterns. They mean what they say. When a reversal pattern forms, it indicates the market will move in the other direction. When a continuation pattern forms, it signals the market will continue moving in its predominant direction. Most chart patterns develop over several bars and vary in size, duration and appearance.
While chart patterns are fairly basic and easy to memorize, in their simplicity lies their biggest danger. Chart patterns with the exception of so-called micro-patterns and, to a lesser degree, gaps are largely subjective.
Because of their highly subjective nature, chart patterns demand practice, patience and an open mind. Here, well look at their basic construction in the context of standard market conditions, but these three requirements (especially the open mind) are up to the reader. (The article Taking chart patterns to the next level, offers a more advanced look.)
REVERSAL PATTERNS
While its rarely a good idea to trade against any predominant price trend on any time frame, several chart patterns are said to forecast a likely reversal of trend. These include double and triple tops and bottoms, spiked tops and bottoms, rounded tops and bottoms, and head-and-shoulders patterns.
Double and triple tops/bottoms are a series of two or three highs/lows separated by lows/highs. Double and triple tops indicate a forthcoming shift in an uptrend. Double and triple bottoms indicate a forthcoming shift in a downtrend. In both topping and bottoming patterns, the extremes on both sides of the market should be approximately equal (see Time to turn).
The pattern is considered complete and successful when the value of the intermediate price extremes is exceeded. That is, when price drops below the low or lows separating the highs in a topping pattern, and when price climbs above the high or highs separating the lows in a bottoming pattern. The best-known chart pattern, the head-and-shoulders formation, is closely related to the triple top and bottom.
When prices are rising, a head-and-shoulders reversal pattern forms when price recedes from a high (shoulder 1), recovers to rally higher than that previous high (the head), falls below shoulder 1, then rallies again to form another high roughly equal in scope to shoulder 1 before receding again (see Head & shoulders above). Ideally, the lows in the pattern will form a continuous support line. When the final correction closes significantly below that line, it may be time to sell.
Head-and-shoulders patterns occur in both rising and falling markets. The conditions for a bottoming pattern in a falling market are the mirror image of those described for a topping pattern in a rising market.
Even less exact are patterns known as rounded tops and bottoms and spiked tops and bottoms. Rounded tops and bottoms are one reflection of a loss of market momentum. As price reaches the end of a trend, its movement in its predominant direction loses steam. It slows, curves into its apex or trough then starts sliding or climbing in the other direction. Spiked tops and bottoms are the opposite. They are sudden reversals in a previously strong trend. These are short-duration patterns and are difficult to pick up on as they occur. They are also potentially expensive as, without significant confirmation, they require the trader to buy into heavy strength or sell into extreme weakness, otherwise known as attempting to catch a falling knife.
Being bitten by attempting to pick such tops and bottoms has led many traders to adopt a simple rule for reversal patterns: patience. For example, the prevailing resistance or support level must be violated by a significant amount. However, while a set distance say, a 3% breach may help you define and study past success, not all market conditions are the same. Another measure to avoid moving too fast is time, such as only trading once the operative level has been exceeded for two trading sessions.
THE TREND GOES ON
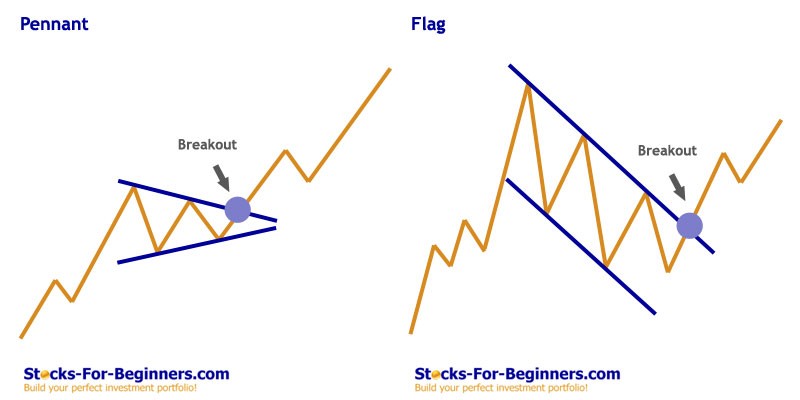
Triangles, pennants, flags and rectangles are often known as continuation patterns. These formations are strikingly similar to each other. Indeed, in many cases only slight differences in the angles at which they develop and the types of markets they develop in set them apart.
A triangle formation is marked by narrowing sideways movement. The declining resistance line forms the top of the triangle, and a rising support line defines the bottom. A triangle pattern is also largely symmetrical. That is, it resembles a geometric isosceles triangle, which has two sides of equal length and equal angles, laid on its side. A rectangle is simply a triangle that doesnt contract, with the support and resistance levels roughly equal in scope.

Generally, the longer it takes a triangle or rectangle to form, the more confident you can be price will experience a swift move once it does break either support or resistance. Most agree that unless a breakout occurs after one-half to three-quarters of the pattern is formed, which is easier to determine on a triangle, it may be a stretch to consider the pattern complete.
When price does break out in the direction of the pre-formation trend, the triangle is often called a pennant, with the earlier price movement referred to as the mast. Likewise, a rectangle formation in this context is often called a flag. Although not always the case, pennants and flags can form slightly against the direction of the prevailing trend.
WITH INTEREST
Although price itself obviously is the most important element to a chart pattern, volume also plays an important role. Volume is the measure of trade activity for a certain bar and can be considered one gauge of the current interest in a current price move.
For many analysts, volume is just as important as the make-up of the chart pattern itself. Basically, for confirmation, you want to see relatively large volume when price breaks the final support or resistance level that marks the completion of the pattern. On some patterns, such as head-and-shoulders formations, analysts also look for rising volume numbers on the intra-pattern extremes.
The alternate scenario dwindling volume can be just as helpful, however. Reversal patterns are especially challenging because they involve trading against a previously proven price direction. If the pattern marking a potential turn occurs on weak volume, perhaps its an opportune time to resume trading with that earlier trend.
In all cases, weak volume or not, just because the prevailing assumption about a price pattern says something will happen doesnt mean you should trade on it. Not all analysis, however clear, demands a trade.
While chart patterns may appear to be the simplest form of technical analysis, the subjective, left-brained nature of these techniques makes it easy for traders to make a mistake. In short, if youre trying too hard to define a particular pattern then its probably time to step away from the monitor. Breaking the instinct to see what hasnt yet developed and only trading when a price pattern is beyond complete and independently confirmed, is one of the simplest, but most difficult, tenets of trading. But a simple understanding of patterns can be a stepping stone to strategy development as many of the most successful trading strategies involve more complex pattern recognition methodologies.


