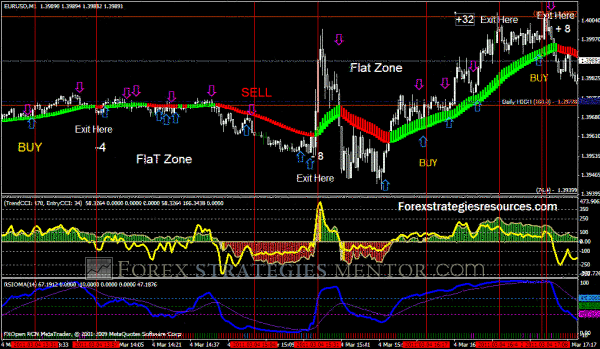
CCI Trading Strategy
Post on: 31 Май, 2015 No Comment

The Commodity Channel Index (CCI) was developed in 1980 and is an indicator that can be used to detect extreme conditions and new trends in assets. It was created by Donald Lambert to track cyclical movements in commodities, but today it is applied to stock, securities and indices. The CCI measures the current price related to an average price of an asset, over a set period of time. It is relatively high when prices are above their average, and low when prices are a way lower than their average. Thus, the CCI can be used to ascertain overbought and oversold assets.
The trading strategy uses two indicators to create signals for trading during a noticeable trend. One of the indicators has to be one that can pick up sensitive fluctuations, and the other has to be a long-term moving average. Comparing these two, a clear signal can be seen for short-term changes in the market, in the same direction of the established trend. This is a good indicator as it is easier to use than more complex multiple indicator strategies that are often confusing to use. However, the trade-off is that signals are less clear, but more frequent, so it is best to use CCI strategy for low volume trades that are more frequent.
The strategy is designed to work in small frames of time with binary options that have an expiry time of a few minutes or less. This type of trading is called scalping, where traders in currencies and stock make a lot of trades in a small amount of time.
How to Use the CCI Trading Strategy
To trade binary options with this strategy, you will need some charting software on hand so that you can add some common indicators. A 15 minute chart or an hour chart is best to identify a long-term trend.
Add a simple moving average to this that can track the trend you have identified in the chart. As the best time period for trading with this strategy is in the minute chart, you should ideally be following the trend on an hourly chart. The simple moving average should be calculated based of 60 minutes.
Now that we have our long term moving average, the other indicator needed is the Commodity Channel Index (CCI). This is to be added to the bottom of the chart, at 14 periods, which is standard. CCI is sensitive and its oscillations can measure the short-term movement in comparison with the simple moving average.
To make a trade, you have to keep an eye out for the moments when the CCI chart touches of crosses the simple moving average. There are basically two situations that can come about in which you will want to trade.
The first is when the chart just touches the moving average, but the candle ends below it. In such a situation, wait until the next candle also closes and then check the CCI indicator. If it is within 100 to -100, i.e. the area between the dots on the bottom chart, then this is your signal to make an entry into the market.
The second scenario is when the market goes over the simple moving average. Then wait for it to cross back down and close below. Check the CCI, and if it is between the 100 to -100 range, it is time to enter the market.
If neither of these two situations occurs, do not make a trade.
In Conclusion
The purpose of this type of strategy in binary options trading is to emit a lot of trading signals for traders who want to enter the market often, but with minimal risk. Traders can take a lot of small positions and make a profit by playing about the average.


