CBOE Volatility Index (VIX)
Post on: 21 Сентябрь, 2015 No Comment

May 22, 2008
CBOE Volatility Index (VIX)
The CBOE Market Volatility index (VIX) was introduced in 1993 by the Chicago Board Options Exchange (CBOE) to measure the expected short-term volatility of the U.S. equity market. Though not necessarily by design, the indicator is also effective in determining the bullish or bearish sentiment of investors. Hence, it is a sentiment indicator, and best used as a contrarian indicator.
The index is calculated in real-time using the Standard and Poors 500 Index (SPX) options. Its calculated by taking a weighted average of the implied volatilities of eight S&P 500 calls and puts having an average time to maturity of 30 days.
So how does a volatility prediction become a measure of sentiment? (The VIX is often called a fear gauge). Because those predictions can be greatly swayed by whether investors are expecting bearish volatility or bullish volatility. As the CBOE site says, During periods of financial stress, which are often accompanied by steep market declines, option prices and VIX tend to rise.
Unlike many market indicators, sentiment indicators such as the VIX prove particualry useful to traders since they indicate how investors feel about the future rather than the present. Additionally, traders may find it easier to apply VIX-based strategies rather than techniques based on stock or index charts alone. Why? The VIX is a ratio (of option prices), and will only fluctuate within a range.with a reading typically no more than 50, and no less than 10. An index chart, on the other hand, may not define levels that are ‘too high or ‘too low, as the general tendency of the market is to always move higher. In other words, the VIX is relative to its history the market is not.
Using the Tool
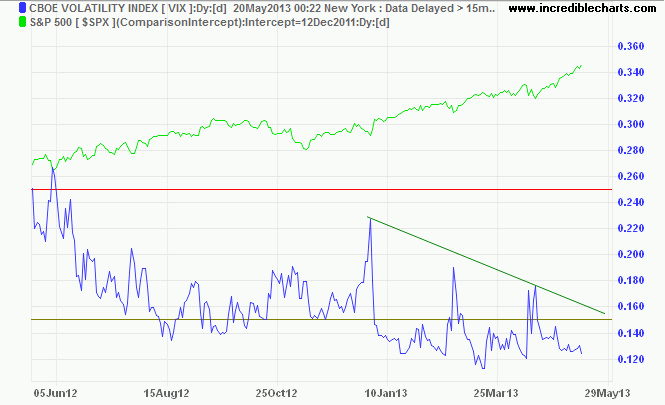
When markets decline, the VIX index typically moves inversely (as seen in chart below), rising to reflect the increase in demand for puts an extensions of the heightened expectation for bearish volatility.
In general, we can expect the VIX to move higher while stocks are falling. We only start to expect a reversal when the VIX has peaked, or made a very tall and very evident spike, and then hinted that it will begin to fall back. When fear peaks, as contrarians, we feel that all of the downturn has been squeezed out and we are poised for an uptrend.
CBOE Volatility Index (VIX) Peaks In Fear/Bearishness
From this example, we can clearly see how the VIX index can be used as a contrarian indicator of market sentiment. Fear and greed will often peak when the market hits a bottom. The higher the VIX, the greater the fear, which market contrarians generally see as a buy signal.
In the same respect, the lower the VIX, the lower the fear. This indicates a complacent market. That complacency is an indication of a market top.traders tend to get comfortable and secure right when tbhey shouldnt before a market top. The chart below illustrates this point rather well. As you can see, the VIX made a pointed bottom right as the market made a short-term top.
(insert image here)
You may have recognized one thing about the VIX the peaks in fear are very well-defined, while the peaks in complacency (sharp, defined lows) are more difficult to discern. There are two general reasons for this tendency. The first is, rallying markets usually coincide with a low VIX level. When the VIX is at a low reading, a large percentage change may not create the same degree of point change that the same percentage exchange would create when the VIX is at high levels. In other words, visually and numerically, the VIX doesnt move as much on the lower side of its range.
The second reason isnt an illusion though. Falling markets are not an upside-down rising market. Investors dont respond to worry the way they respond to elation, even if the underlying percentage of rise or fall in the market is the same. Therefore, the way the VIX moves wont be the same at tops as it is at bottoms.
Further, given the nature of the market to rise over time its unusual to see high VIX levels persist, while its typical to see low VIX levels persist. This can affect the way its interpreted.

Simply recognizing these realities will allow you to successfully understand what the VIX is doing at any given time, and why its doing it. None of it changes anything thuogh the VIX can be used to spot likely tops and bottoms.
Best Practice Reversal Confirmation
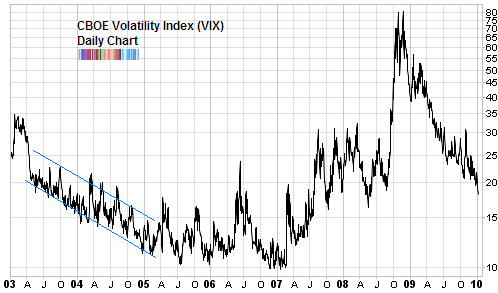
We mentioned above that a VIX reading of 10 was generally low, while a reading of 50 was on the high side. HOWEVER, its crucial to understand that even though the VIX has traded in that range in years past, it may not use all of that range all the time. Before 1997, it was a rarity to see the VIX above 20. Between 1997 and 2003, it was rare to see it under 20. Between 2003 and 2006, it was again rare to see it above 20.
The tricky part is knowing exactly when the VIX peaked. While a higher VIX does indicate plenty of fear, we want to know that all the fear, bearishness, and pessimism has been exhausted. To do that, we actually want to see the VIX begin to decline off of a high.
Best Practice Bollinger Bands
One of the most useful ways measure extremes in the index is found in the 20-day Bollinger Bands on the VIX (not shown here). When the VIX index reaches an extreme by closing outside of these bands and then sees a close back into the band, you can expect that shift in the market is likely to occur. Markets tend to bottom due to a peak in fear (on a high VIX reading over the upper band), while tending to top after an extreme in greed is reached.
Best Practice Timeframes
As traders, your timeframe is not measured in years, but rather weeks or even days. To make use of the VIX effectively, we need a way to spot its short-term extremes on a daily basis while at the same time remain cognizant of the bigger-picture scenario.


