Bull Put Spread Calculator
Post on: 13 Апрель, 2015 No Comment

A lot of people are trading bull put spreads these days so I wanted to share my bull put spread calculator that I use to evaluate these trades. If you click on the link below you can download my credit spread calculator that can be used for both bull put spreads and bear call spreads.
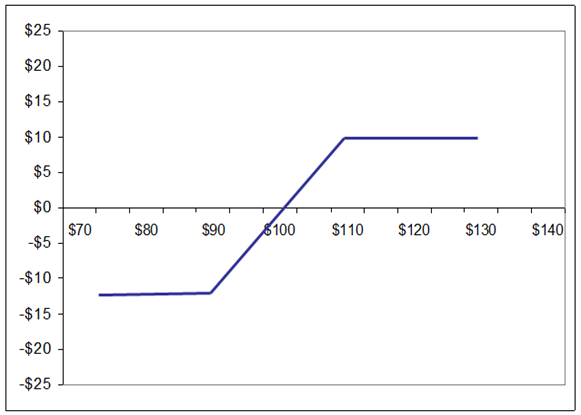
When trading bull put spreads (and any options strategy for that matter) its important to know your maximum risk and potential profits. A bull put spread is a bullish strategy also referred to as a credit spread due to the fact that you receive option premium (a credit into your account) after placing the trade. Generally most traders will set up their bull put spreads with out-of-the-money puts. This means that their potential losses are more than the income they are bringing in for placing the trade, but the stock will have to decline, in some cases significantly, before experiencing losses. Brokerages will require you to put up margin for bull put spreads. At most brokerages, this will be equal to the amount of potential losses for the trade. The attached calculator will show you how much margin you will be required to come up with, but you should check with your broker on how they calculate their margin requirements.
Download the Bull Put Spread Calculator.
There are two trading methodologies for placing bull put spreads trading with the trend and swing trading. Trading with the trend involves identifying a clear uptrend and then selling a bull put spread below recent support levels. Trading with the trend has advantages in that you have a clear uptrend to follow and youre not trying to pick a bottom or catch the falling knife. The downside of this method is that in an uptrend volatility will be low meaning lower option premiums. As a result, in order to generate the same amount of income from your bull put spreads, you will need to place your strikes closer to the current stock price.
When swing trading bull put spreads, you are trading against the trend and trying to (as near as possible) pick a bottom. The advantage of this is that if a stock has been falling fast, volatility should swell meaning you can either receive a higher premium OR move further away from the current price.
Lets now look at an example of the bull put spread on SPY and see how the bull put spread calculator works.
On Dec 30, 2011 SPY closed at 125.50. The February 120 puts were trading around 2.27 and the 119 puts were trading for 2.07.

Using the calculator, you enter the bid and ask prices of each option to see that a February 120-119 Bull put spread could be sold for around $0.20 (cell G9). If you were entering the trade in your brokerage platform as a spread, this is the price you should enter to start with as it is the mid-point of the spread. From there you can drop your price a little depending on how urgently you feel you need to get into the trade. Otherwise you can leg into the trade by trading each contract separately.
The bull put spread calculator also shows you the maximum loss and maximum gain in dollar terms, as well as the potential percentage return if the spread expires worthless. Another feature is that it shows you the percentage decline to your strike prices allowing you to have a good understanding of your risk.
Using the example above, all you need to enter in the calculator is the current price of the stock (cell D1), the strike prices of your spread (D6, D7), and the bid/ask spread of those options contracts (E6-F7). The calculator will do the rest.
Ill add a video shortly showing you how to use the calculator with live examples. I use this calculator every time I enter a bull put spread, a bear call spread or an iron condor. Download it and give it a go. I hope you find it useful! As always, if you have any questions, just drop me a line.
Here’s to your ultimate success.


