Bollinger Bands_1
Post on: 26 Июль, 2015 No Comment

Bollinger Bands
IV. FOREX Trading Strategies
V. Technical Indicators
Bollinger Bands
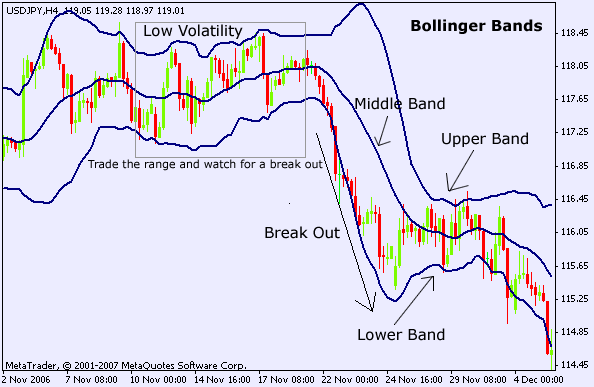
The Bollinger Bands are a form of volatility indicator based upon the standard deviation of a moving average of the prices over a given period of time. Drawn as an overlay on price charts it allows a comparison between prices levels and their mean and identifies any significant departure of prices from such mean. Graphically, Bollinger Bands are represented by.
1) The simple moving average line in the middle
2) An Upper band (SMS plus 2 standard deviations)
3) A Lower Band (SMA minus 2 standard deviations)
Combining the characteristics of both envelopes and volatility indicators, the basic interpretation of Bollinger Bands involves the tendency of prices to stay within the upper and lower bands, and its ability to directly reflect volatility by contracting during periods of stagnant prices and expanding in times of explosive price movement.
Among the more common uses of the indicator are :
1) Trend Confirmation. A trend is deemed confirmed by the indicator when prices close outside of the band going into the movements direction.
2) Reversal Identification. Tops and Bottoms made outside of the bands followed by tops and bottoms within is considered a signal for the possible reversal of an existing trend.
3) Price Target Projection. Price targets may be projected based on the tendency of price movements originating from one band of ending up at the other band.
4) Break Out Identification. Breakouts from congestion is preceded by a tightening of the bands reflecting lessening volatility.
In the preceding chart, the blue ellipses highlight instances where prices closed beyond the Bollinger Bands thus confirming the start of a developing trend or an extension of such a trend as observed in the second ellipse.
The above chart demonstrates the use of Bollinger Bands, for price projection and as a reversal signal. The Yellow bars highlight the use of the lower BB for price projection and as a moving support area while the Blue bars indicate resistances.
The Bollinger Band is named after its developer John Bollinger, whose researched focused on volatility as a key variable into his trading of index options.


