Binomial Model and it s Application to American Style Option Contracts
Post on: 4 Май, 2015 No Comment

The binomial model is a mathematical method for the pricing of American style option contracts (Option contracts that have a European exercise style will generally be priced using the Black Scholes Model ). A binomial method for pricing derivatives was first suggested by William Sharpe in 1978, however, during 1979 three academics formalized a framework for pricing options using a binomial method, which led to today’s binomial model being referred to as Cox Ross Rubinstein method (named after the authors John Cox, Stephen Ross and Mark Rubunstein in 1979).
There have been many other variations since then but the CRR model remains dominant.
The Binomial Distribution = Coin Tosses
A binomial sequence is characterized by a series of yes/no occurrences. A common example of a binomial set of outcomes is with a series of coin tosses. Given that there can only be one of two results, the series is said to be binomial. Note: this type of series is also referred to as Bernoulli trials.
With Bernoulli trials (and hence a binomial series) the probability of a correct answer remains constant no matter how many trials have taken place. The trials are therefore said to be independent of one another.
The above illustration is an example of the possible paths that can occur when tossing a coin for three successive periods. At each coin toss the probability of the result being a head or a tail is always the same, which is 50/50 — regardless of the results prior.
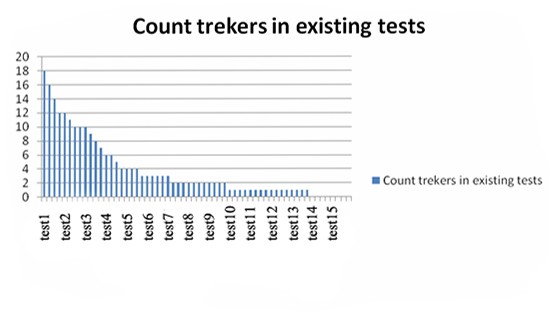
This iteration of yes/no occurrences produces a binomial distribution. Take a look at the below distribution graph;
In this example, I ran a large series of yes/no occurrences with a probability of each being 50/50 (the same as the coin toss idea) and plotted how many times each result occurred in a row.
You will notice that most of the outcomes occur at 1 i.e. on after the other. The more occurrences in a row the least likely they are to occur. This is the basic idea used in the binomial model to build the stock’s distribution. You can download the spreadsheet I used for this;
Excel Binomial Distribution Graph
A Binomial Stock Tree
Just like a coin toss scenario, the binomial model used for a stock’s price path is built on the idea that the stock’s price can either go up or down a certain percent for the period. The period examined is broken up into multiple intervals, where each point the stock has an opportunity to either rise of fall by a given percent. At each point evaluated the stock therefore must satisfy;
Su = S(1 + u)
Sd = S(1 + d)
Where;
Su = Stock up, Sd = Stock down, u = percentage increase and d = percentage decrease.
The outcome of these up and down movements produces a binomial stock tree. This tree describes all the potential price paths that the underlying can take until the expiration of the option. Just like coin toss, although instead of heads and tails the outcomes will be the securities market price.
This graph illustrates a three period binomial tree using a stock price starting at 100.
Reverting Back to Calculate the Option’s Price
Once the binomial tree has been created, the option value at the end point is calculated using;
Call Price = Max(Stock — Exercise Price, 0)
Put Price = Max(Exercise Price — Stock, 0)
The model then works backwards through the stock tree and calculates the option price at each point using the risk neutral valuation approach;
Max((p * a + (1 — p) * b) * Exp(-rate * t / n), c — k)
Where;
p = Probability
a = Option price at next interval up
b = Option price at next interval down
t = Time in years
n = Number of steps/calculations used in the tree
c = Stock price at current interval
k = Strike price
Here’s a working example in Excel that calculates the value of a call option using the binomial model;
Binomial Model
Binomial Vs Black Scholes
The Black and Scholes model is another option pricing model used to price option contracts. The B&S is used for options where the option style is European i.e. the holder cannot exercise the option prior to the expiration date. However, holders of call options may want to exercise the option prior to the expiry date in order to collect the dividend. This usually happens right before a stock goes ex-dividend (ex-dividend date is the date, which if you buy the stock after means you will not receive the dividend). Option contracts that allow for early exercise are said to be of an American style.
The iterative structure used when pricing options using a binomial model allows for the pricing due to early exercise. This is made possible as the time frame of the option until expiration is broken up into many different price paths and at each point in the underlying price path the option considered for early exercise. If it is more valuable for the option holder to exercise the option, then the value of the option at that price point is adjusted to equal the intrinsic value. This value is discounted using the risk-neutral valuation method and this process flows on up the tree until the final mode is reached.
Note: Due to the potentially large number of calculations involved in a binomial model it is computationally slower than a black and scholes model.
Other Excel Examples
My implementation of the binomial model is limited, however, here are some other well put together spreadsheets using the approach described here to price American options;
Kurt Hess’s Binomial Model
The Hedger — Wikispaces
Pun Wai Tong’s Binomial Model


