Binary Options Trading with Fibonacci Retracements
Post on: 18 Июль, 2015 No Comment

Before you get into using Fibonacci retracements while trading binary options, it is important that you understand the fundamentals of the Fibonacci sequence so that you can use it rightly. The Fibonacci sequence is a sequence of numbers following the pattern of 0, 1, 1, 2, 3, 5, 8, 13, 21, 34, 55, 89 and so on. In this sequence the sum of the first two numbers gives rise to the third number. Similarly, the sum of the second and third number will give rise to the fourth and so on.
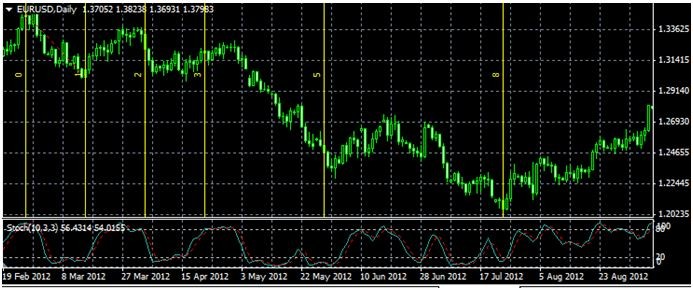
The most interesting thing about this sequence is that it can be seen in various areas including the biology of plants. In fact, the sequence is also observable in the structure of several galaxies and other structures in the universe. You must keep in mind that the Fibonacci strategy is a long term one because these patterns may take a while to emerge. There are several strategies used to make the most of the Fibonacci sequence and each one of them has their own sets of advantages.
In one kind of Fibonacci strategy, the use of daily charts is central to forming the method. In this method, you need to figure out areas in which you can expect the price of any asset to hit after it takes an upswing representing a strong trend. However, the only way to develop any kind of judgement is to observe the market for a long enough period to get an idea of these frequenting areas. There are many tools based on Fibonacci strategy that can give you a fixed number of possible spots. Using these possible spots, a trader can go for the touch option trade depending on the spots.
- In the first type of retracement, the lowest and the highest points of the uptrend are marked.
- In the second kind, the highest and the lowest points of a downtrend are demarcated.
Once you have a clear idea of these points by tracing an upswing or downswing with a Fibonacci tool, you also need to know where this pattern of Fibonacci retracement is going to end. The typical pattern of retracement points appearing in any kind of Fibonacci retracement follows a pattern of this kind: 23.6%, 38.2%, 50%, 61% and 100%.
Having these points clearly defined will help you establish the call/put trade option where a trade is placed at points where the retracement pattern of any asset comes to an end. Stochastics oscillator is a great way to figure out the Fibonacci retracement levels of any asset.
Though this method of Fibonacci retracement has proven to be quite effective in quite a lot of cases, it must be used suitably. Once you have this clear in your mind, you will find it easier to call and put trades as well as trade in several touch/no touch trading methods. Demos are a great way to practice these steps but at the end of the day, you should accept the fact that since the market still remains unpredictable, there is a chance that you may go wrong on a few occasions.


