Binary Options Strategies Using Fibonacci Retracement Levels Learn Binary Options Trading
Post on: 18 Июль, 2015 No Comment

Binary Options Strategies Using Fibonacci Retracement Levels 5.00 / 5 (100.00%) 1 vote
Fibonacci retracement levels are ratios used to locate potential price reversal points. The name is derived from the famous Italian mathematician Leonardo Fibonacci who identified the key numbers in the thirteenth century. Retracement levels are created by drawing a trend line between two extreme price points in a trend, and then dividing the vertical distance by the Fibonacci ratios of 23.6%, 38.2%, 50.0% and 61.8%. After a price advance, technical traders apply Fibonacci ratios to forecast the extent of a pullback or a correction. Fibonacci retracements are equally applicable in a decline to project the extent of a counter trend bounce. The three most popular Fibonacci retracement levels are 61.8% (golden ratio), 50.0% and 38.2%. These levels can be combined with price patterns and other technical indicators to create a profitable binary options strategy.
A Profitable Binary Options Strategy
Fibonacci retracement levels are based on the principle that the direction of the ongoing trend is likely to continue once the price of an underlying asset has retraced to one of these ratios. The first step in developing a binary options strategy based on Fibonacci retracement is to locate a clear trend on a chart. We wait for prices to pullback, and look to enter the market with a Call or a Put option depending on whether the prior trend is up or down. In case of an uptrend, we draw the Fibonacci lines form the Lowest to Highest point of the trend, and do the reverse for a downtrend. Ideally the retracement will stop at the 38.2% Fib level or even better at the 61.8% level.
Two Trades Based on a Simple Fibonacci Binary Options Strategy
The following are real-time examples of trades taken on EUR/USD using short-term binary options contracts.
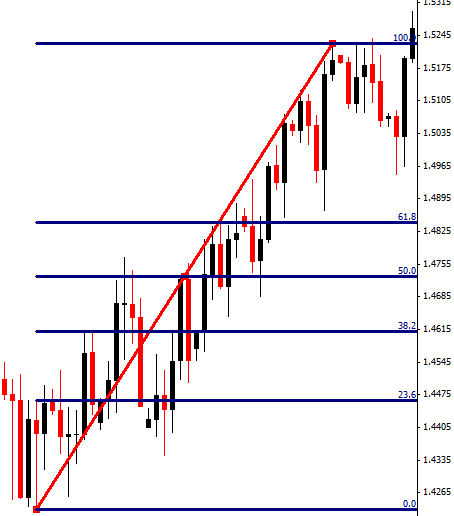
Real-time trades taken on EUR/USD during an uptrend

In the above 5-minute chart, there is a clear uptrend, and we draw the Fibonacci Lines from the Low to the High. The pair first makes a small pullback to the 61.8% level, following which, the first green candle can be used to initiate a Call trade. Prices again stall at the 50.0% level, which can be used to add to the existing position. EUR/USD swiftly resumed the uptrend, and the trade resulted in a nice profit.
Real-time trades taken on EUR/USD during a downtrend
We next look at a profitable Fibonacci trade during a downtrend. In the above screen-shot, the two retracements to the 50.0% level are marked by green arrows. These were ideal places to execute a Put trade. We, of course, have to wait for some sort of price confirmation before entering into the market. This can either be the break of a previous low, or a down candle bar. We took the second pullback from the retracement as a confirmation, after which the pair made a strong move to the downside.
- Trade highly volatile assets such as Forex pairs.
- Start by practicing on a demo account.
- Live trade only once you are level to identify the Fib levels just by eyeing them.
- Set up your chart time frames according to the expiries you wish to trade.


