Best Volatility Indicator You Decide
Post on: 17 Июнь, 2015 No Comment

If you happen to be new to stock trading and looking to learn a few things about volatility such as what the best volatility indicator is, then you have come to the right place. Before we elaborate on this topic and before you take a plunge into the market without giving your indicator any thought let us take a look at your options. By the end of this post you can make your own assumption as to what you would consider being the best volatility indicator before implementing it into your trading strategy.
The Volatility Indicator Explained
Volatility can be defined as a measure of the dispersion of return for a given security. Put short the standard deviation between the returns of the same security is used to measure what we call volatility. The higher the volatility, the the more riskier the security will be. The lower the volatility, the less riskier the security will be. The volatility indicator is the tool that helps, as the name implies, to determnine the volatility. Furthermore, also assists traders in determining potential market reversals, strong trends, and price bottoms.
Top Volatility Indicators
1. The Average True Range (ATR)
The Average True Range Indicator, unlike some of the other indicators you will come to know, does not reflect price direction or predict price. Instead, the Average True Range Indicator is specifically designed in measuring the degree of price volatility.
2. Bollinger Bands
Bollinger Bands are primarily used in comparing volatility and relative price levels over a set period of time. These bands are also often referred to as standard Bollinger Bands and is believed to be one of the most effective volatility indicators you will come to know in stock trading analysis .
3. Fibonacci Bands
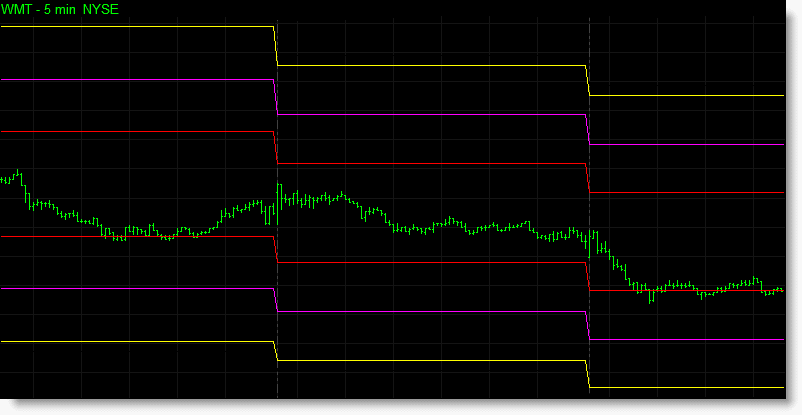
The Fibonacci Bands are in many ways similar to the Bollinger Bands indicator. However, what makes it different from the rest is the fact that this indicator is based on the Average True Range instead of the Standard Deviation. Moreover, as the name implies uses Fibonacci Ratio as a multiplier in determining the volatility of a security.
4. Chaikins Volatility
The Chaikins Volatility Indicator is used to measure the volatility of a security by using the trading range between highs and lows for each period. Furthermore, unlike the Average True Range Indicator, the Chaikins Volatility Indicator uses no trading gaps in measurement and prediction. High values indicates large price changes and low values indicates that prices remain constant.
5. Standard Deviation
The Standard Deviation might not be the very best volatility indicator that you will come to find in trading, however, will surely come in handy. This indicator is commonly used in measuring the variability of data sets. Should the respective data be close to the average value, you will have a small standard deviation and should the data be spread over a larger value range, you will have a big standard deviation.
The aforementioned volatility indicators are some of the most widely, and most popular indicators used in trading today. While they are all effective, there is no real way of putting claim on which is the best volatility indicator available to you. This is for you to decide. Since you now have a better idea of the different volatility indicators available to you, take some time in experimenting with them to find your own personal favorite.


