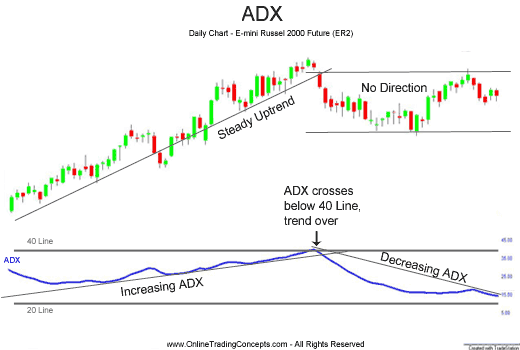
Average directional movement index – ADX
Post on: 16 Март, 2015 No Comment

They are a set of indicators developed by Welles Wilder that are plotted with three lines ADX, DI+ and DI-.
The ADX is calculated from the Directional Movement Index.
The Directional Movement Index (DMI) is decomposed into DI+ (Positive Directional Index) and DI- (Negative Directional Index) and is a measure of the amount of movement upward or downward that have the prices.
What is the use?
The ADX attempts to measure the strength of the trend currently in force.
Is a standard oscillator, ie always moves in the same scale as in this case is between 0 and 100.
DMI is a trend indicator normalized on a scale of 0 to 100.
How is it used?
ADX used as default parameter is the value 14, the same used for the calculation of DMI.
A low ADX, typically less than 20 indicates a market without trend and low volatility. A crossover above this level 20 can mark a beginning of a trend (bearish as bullish). If the ADX has a value above 40 and starts to decline is a sign of weakness of the current trend.
The ADX does not reveal the direction of the trend, its use is to determine whether or not the market is in trend and evaluate its strength. Its usefulness lies in supporting more to the decisions in indicators or oscillators that behave better by the type of strengthmarket in which we find ourselves.
The DMI is used with cuts of its lines: The DI+ crosses upward to the DI- activates a purchase, if the DI- crosses upward to the DI+ activates a sale.
Tips of Trading:
Jointly use both indicators simultaneously, ADX is used to filter the signals provided by the DMI:
Buy or opening long position => (DI+ crosses upward to the DI-) AND (ADX rising above 20.)
Sale or Close the long position => (DI+ crosses below DI-) O (ADX decreases.)
Credit sale or short position Opening => (DI- crosses upward to the DI+) AND (ADX rising above 20.)
Buy or Close the short position => (DI- crosses below DI +) O (ADX decreases.)
Indicator References: Wilder, Welles, Jr. New Concepts in Technical Trading Systems. Trend Research. McLeansville, NC
The ADX is a combination of two other indicators developed by Wilder, the positive directional indicator (abbreviated +DI) and negative directional indicator (-DI).[2] The ADX combines them and smooths the result with an exponential moving average.
To calculate +DI and −DI, one needs price data consisting of high, low, and closing prices each period (typically each day). One first calculates the directional movement (+DM and −DM):
UpMove = todays high − yesterdays high
DownMove = yesterdays low − todays low
if UpMove > DownMove and UpMove > 0, then +DM = UpMove, else +DM = 0
if DownMove > UpMove and DownMove > 0, then −DM = DownMove, else −DM = 0
After selecting the number of periods (Wilder used 14 days originally), +DI and −DI are:
+DI = 100 times exponential moving average of +DM divided by average true range
−DI = 100 times exponential moving average of −DM divided by average true range
The exponential moving average is calculated over the number of periods selected, and the average true range is an exponential average of the true ranges. Then:
ADX = 100 times the exponential moving average of the absolute value of (+DI − −DI) divided by (+DI + −DI)
Credit: Wikipedia.org
Example Image ADX in the Metatrader platform


