Average directional index
Post on: 16 Март, 2015 No Comment

Understanding Average Directional Index (ADX)
by J Victor on February 10th, 2011
Introduction:
Average directional index evaluates the strength of the current trend, be it up or down. The ADX is an oscillator that fluctuates between 0 and 100. The indicator does not grade the trend as bullish or bearish, but merely assesses the strength of the current trend. A reading above 40 indicates that the trend is strong and a reading below 20 indicates that the trend is weak. An extremely strong trend is indicated by readings above 50.
What does it measure?
ADX does not indicate trend direction, only trend strength. It is a lagging indicator; that is, a trend must have established itself before the ADX will generate a signal that a trend is underway.
ADX can also be used to identify potential changes in a market from trending to non-trending. When ADX begins to strengthen from below 20 and moves above 20, it is a sign that the trading range is ending and a trend is developing.
The ADX indicator does not provide buy or sell signals for investors. It does, however, give you some perspective on where the stock is in the trend. Low readings and you have a trading range or the beginning of a trend. Extremely high readings tell you that the trend will likely come to an end.

Overall, what is important to understand is that this indicator measures strong or weak trends. This can be either a strong uptrend or a strong downtrend. It does not tell you if the trend is up or down, it just tell you how strong the current trend is.
Construction of ADX.
We will not go into the formulas for the Indicator here. However what we need to know is that:
- ADX is derived from two other indicators
- The first one is called the positive directional indicator(sometimes written +DI) and the second indicator is called the negative directional indicator(-DI)
- The +DI Line shows how strong or weak the uptrend in the market is.
- The -DI line shows how strong or weak the downtrend in the market is.
- ADX is the average of the above two lines and hence, it shows the strength of the current movement.
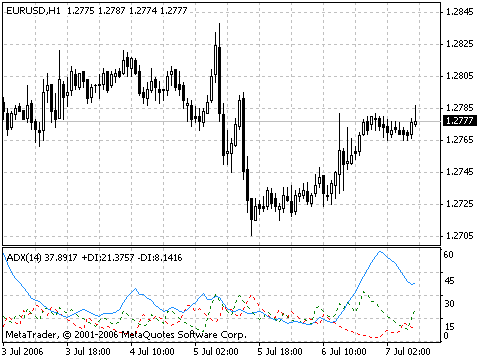
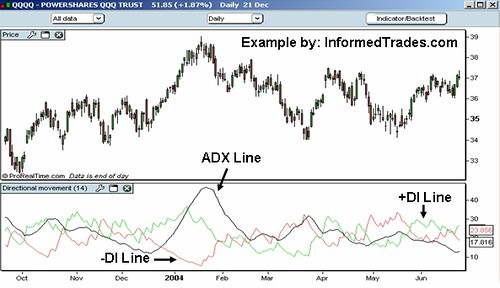
- On screen, the ADX appears below the stock price chart. The +DI (normally a green line) and –DI lines (red line) would accompany the ADX (Black line). So you see three lines as shown in the figure below.


