Asset Pricing Model
Post on: 16 Март, 2015 No Comment

New Concepts in Asset Pricing
Nilanjana Chakraborty
Copyrighted Material (Working Paper: 2011-12)
contact: dr.nila.chakraborty@gmail.com
This is a theoretical paper that develops a model for asset pricing using the supply and demand framework, known to the economists since long. Accordingly, the price of a stock ‘i ’ on a day ‘t ’ is found to be dependent on seven independent variables based on four basic parameters – stock volume ( vi,t ), index price ( pm,t ), index volume ( vm,t ) and time trend ( tt ) and is given as follows:
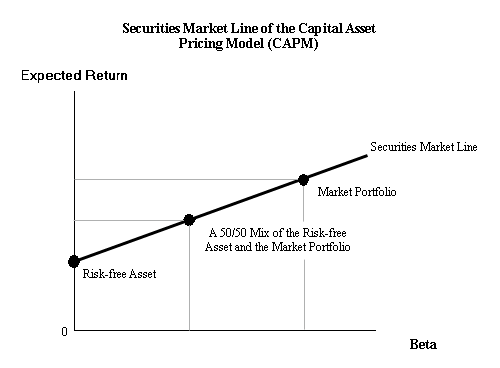
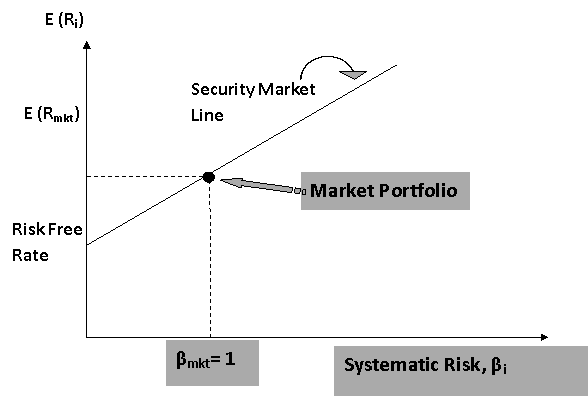
This indicates that the stock return is a rational function (a quotient of two polynomials) of two consecutive observations of these seven independent variables and hence the constituent stock returns cannot add up linearly for a portfolio! Further, the returns generated by this rational function (RF) model increase but tend to flatten out across increasing risk similar to the extant empirical evidence, reported by numerous empirical studies based on the Capital Asset Pricing Model (CAPM) developed by Sharpe (1964) and Lintner (1965), which had remained unexplained until now and hence formed the basis of the ‘Joint Hypothesis Problem’ (Fama 1970; Fama and French 2004). According to the Joint Hypothesis Problem the discrepancies between the actual returns, which plotted out flatter across risk as compared to the returns predicted by CAPM, and the returns estimated by CAPM were probably due to either or both of the two possibilities – (a) flawed asset pricing model or (b) inefficient capital markets. The RF model developed in this paper indicates that the asset pricing model needs to be modified before we can examine the Joint Hypothesis. In addition, the RF model indicates that both the price and the volume of a stock together express the total economic impact of any economic event, or a time period in general, and a Matrix scheme has been developed to capture this aspect in order to gain deeper understanding of the dynamics of a market operating under equilibrium. As per this Matrix arrangement, three possible outcomes for both price and volume of the stock – increase, no change or decrease, are arranged in a 3×3 matrix and the economic implication of each cell has been discussed to indicate the inference applicable to the event or the time period being studied. An improved understanding of the investor behavior should thus help in making judicious decisions for investments as well as in drawing more accurate general inferences from the event studies.
The RF model developed in this paper is built on the most basic market variables and hence hopes to circumvent the shortcomings of its predecessors, like CAPM, which were built from derivative variables, which in turn depended on the behavior of other variables. The RF model thus indicates that (a) we must model prices, not returns, since returns are rational functions derived from the prices; (b) there are factors other than the index price that we should consider when modeling stock prices, like stock volumes, index volume and time trends; and (c) the price and volume variables of a stock are complementary to each other since both are determined by multiple factors, giving rise to the possibility that an event might induce a change in one of these two variables leaving the other unaffected and hence both the variables should be considered together in evaluating the total economic impact of an event. These conclusions are very significant and fundamental in their implications.
Further, the RF model also indicates that the stock return is subject to certain ranges and limits in order to generate positive and slightly upward-sloping flattish curves that have been reported by the empirical evidence. The returns obtained from the RF model, for different values of the common beta coefficient representing the overall risk due to all the seven independent variables defining the stock price for a given market at a given time, tend to lie within narrow ranges giving the ‘flattening’ effect because of the mathematical characteristics of the rational function. Due to the shape of the curve obtained by plotting the asset returns against the common beta, it seems that the best investment policy for the investors would be to focus on the assets that have lower beta values since beyond a point, the increase in returns for increasing risk are negligible.
Like any other mathematical model describing empirical realities, the RF model also needs to be tested out using real life data to assess its practicality. Besides, it would be interesting to study the mathematical behavior of the rational function at a greater depth from the angle of a stock investor. It is also possible that factors other than the basic market variables that have been discussed here influence the stock price. If so, such factors need to be identified alongwith the underlying theoretical rationale. In addition, the RF model itself could be further refined through careful mathematical modeling that improved upon the approximations that have been used in this paper. Hopefully, there would be studies in the near future that would attempt to address these objectives.
References:

Fama, Eugene F. 1970, Efficient Capital Markets: A Review of Theory and Empirical Work, Journal of Finance. 25, 383-417.
Fama, Eugene F. and Kenneth R. French, 2004, The Capital Asset Pricing Model: Theory and Evidence, The Journal of Economic Perspectives. 18, 25-46.
Lintner, John V. 1965, The Valuation of Risk Assets and the Selection of Risky Investments in Stock Portfolios and Capital Budgets, Review of Economics and Statistics. 47, 13-37.
Sharpe, William F. 1964, Capital Asset Prices: A Theory of Market Equilibrium under Conditions of Risk, Journal of Finance. 19, 425-42.
Click here for a brief web presentation


