An Introduction to Fibonacci Retracement Levels
Post on: 18 Июль, 2015 No Comment

How to use the Fibonacci Retracement to Predict Future Price Movements
If you have a requirement to forecast the future price direction of an asset, then you could utilize the Fibonacci Retracement to assist you in doing so. This is because this tool is one of the top technical indicators that can be used to trade the four main asset classes, which are stocks, forex. commodities and futures.
What are Fibonacci Retracements and how best should you use them?
The retracements were first discovered by Leonardo Fibonacci in the 12th century. This concept advises that price will retrace by predetermined percentages of its initial movement before it proceeds in its initial direction. The percentages are 61.8%, 50.0% and 38.2%. Leonardo detected these significant ratios when he noticed that a person’s belly button was located at precisely 61.8% of the distance between the feet and head. In addition, you will also discover that your elbow is positioned at 61.8% of the distance between your shoulder and hand. There are numerous other examples in nature.
Can you utilize these facts to assist you in trading binary options. Yes you can because Fibonacci retracements also have a strong presence in the price movements of assets.
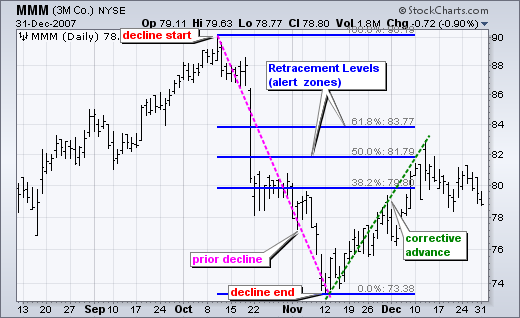
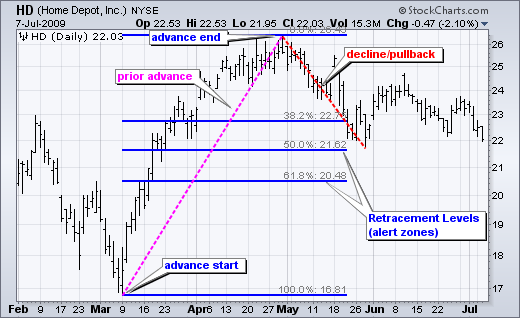
For instance, note the red line drawn from the bottom to the top of the bull trend on the right of the above chart. You can then use the displayed Fibonacci retracements to help you determine how far price is expected to retract before advancing again in its initial direction.
Fundamentally, if you intend to utilize this indicator, then you must locate those trading charts that are displaying the largest price trends as possible. You must then draw a line connecting the tough to the peak, as demonstrated by the red line in the above diagram. You can then request your trading platform to generate the Fibonacci retracements automatically by producing lines similar to the blue ones in the above chart.
These lines depict the retracement distances that are equal to 38.2%, 50% and 61.8% of the total initial price movement that is represented by the red line in the above diagram. For example, the 50% retracement represents the level that price will need to hit if it reverses by 50% of the total distance of its initial bull movement.
If price retreats and then bounces against one of the Fibonacci retracements, then this could be a good signal to open a new binary option in the direction of the original price movement. For instance, if price bounces against the 61.2% retracement in the above diagram, then you should regard this development as a strong buy signal to open a new CALL binary option.
How to use the Fibonacci Strategy
So, how can you trade binary options using a strategy based on the Fibonacci retracements? Here is a procedure that is successfully utilized by many traders:

- You first need to select an asset that has a strong tendency in advance in well-defined trends. Good examples are the EUR/USD, Gold and the GBP/JPY, etc.
- As the Fibonacci retracements produce more reliable statistics when applied to trading charts exhibiting the longer time-frames, you can well-advised to select the daily.
- You then need to display the Fibonacci retracements on your trading chart. To do so, you must select this tool on your trading platform and then move your mouse from the trough to the peak of a bullish trend or the top to the bottom of a bearish one. On the following EUR/USD chart, the retracements are displayed for a bullish trend.
Let us now look at the Fibonacci strategy in more detail. The first two requirements stated above are satisfied by the above chart. A strong trending asset, i.e. EUR/USD is displayed on the daily chart. You must now wait until you observe that this asset is advancing in either a strong bullish or bearish trend. In the above diagram, you can confirm that a well-developed bullish movement is in progress displayed towards the left of the chart.
You must now wait until price records a peak and begins to retract. You can master how to detect reversal patterns more readily by learning how to interpret candlestick patterns. For instance, in the above diagram, the peak is announced by the formation of the Bearish Harami Reversal candlestick pattern.
Once this task is successfully completed, you must then activate the Fibonacci tool so that its main levels are displayed. You can now instigate a ‘Touch’ PUT binary option by targeting the first Fibonacci level at 38.2%. Price just has to hit the level at least once before expiration for your trade to finish ‘in-the-money’. The Fibonacci strategy has developed an impressive track-record for exploiting the benefits of ‘Touch’ binary options. This is a good objective to achieve because ‘Touch’ binary options can payout as much as 300% returns.
The fundamentals of the Fibonacci theory are quite simple to grasp. However, you will need sufficient trading experience to help you overcome a number of obstacles. For example, you must learn techniques, such as candlestick patterns, that can help you readily identify reversals. Also, you will need a sound money management strategy to prevent you from risking too much money per trade. This is essential because ‘Touch’ binary options involve high levels of risk since price will not always retract even to the first Fibonacci level.


