Algo Trading India Moving Average Convergence and Divergence (MACD) & Momentum
Post on: 16 Март, 2015 No Comment

Saturday, September 11, 2010
Moving Average Convergence and Divergence (MACD) & Momentum
Moving Average Convergence and Divergence (MACD)
Definition:
Moving Average Convergence and Divergence (MACD) is the difference between a fast exponential moving average (fast EMA) and a slow exponential moving average (slow EMA). The name was derived from the fact that the fast EMA is continually converging towards and diverging away from the slow EMA.
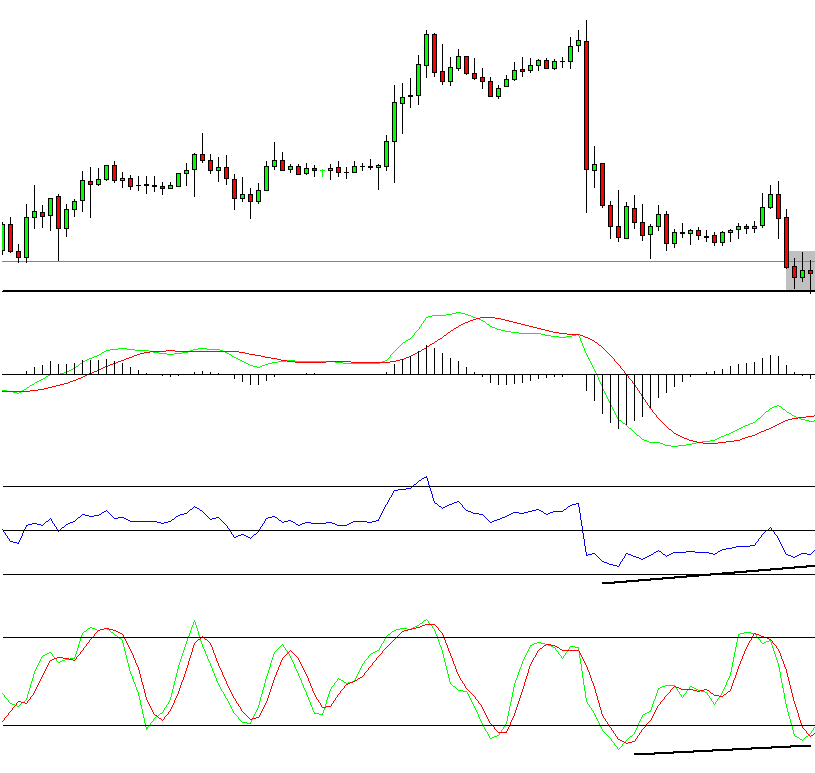
In IQ Chart, we show the difference between the two moving averages (the MACD) plotted as green or blue vertical lines, and a red signal line plotted over the MACD which is a moving average of the MACD line.
Interpretation:
The MACD can be a very helpful technical indicator, and is subject to several conventional interpretations which can all be useful depending on your trading and investment philosophies.
One interpretation is that a positive MACD value is a bullish signal, and a negative MACD value is a bearish signal.
The crossover interpretation posits that the signal line can be used alongside the MACD to determine the appropriate entry and exit point. (The signal line is a moving average of the MACD line). When the MACD falls below its signal line, it can be considered a sell signal. Similarly, a buy signal can be interpreted when the MACD rises above its signal line.
A third popular method of interpretation is that when the MACD is making new highs or lows, and the price is not also making new highs and lows, it signals a possible trend reversal. This type of interpretation is often verified with an overbought/oversold oscillator.
MACD Slope Indicator
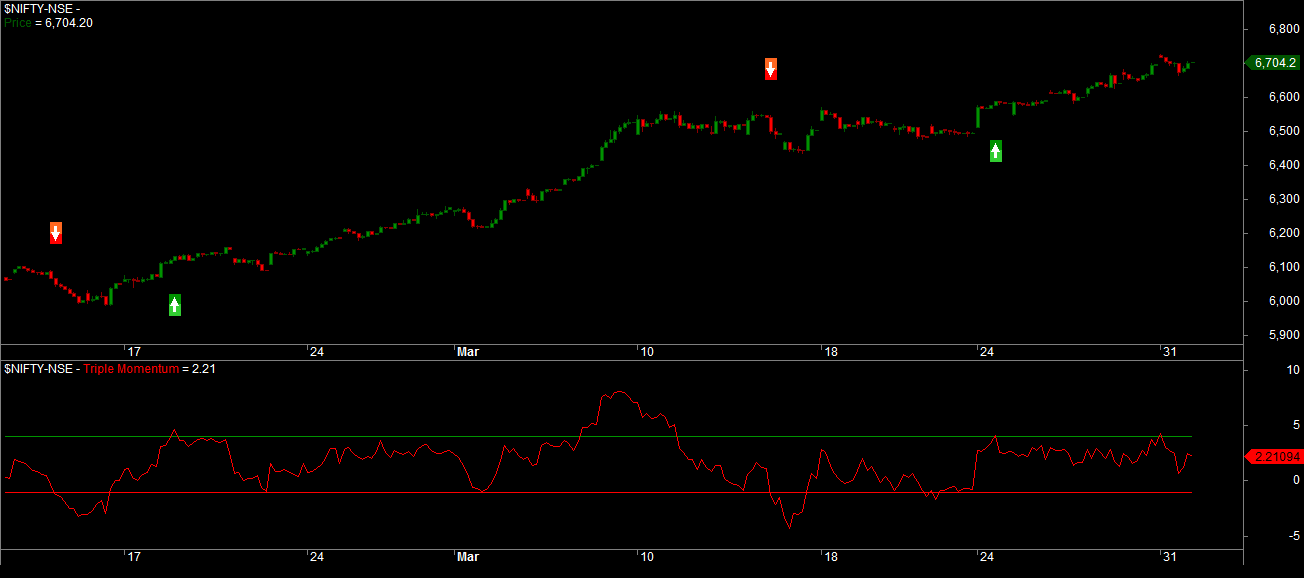
The MACD slope indicator is based on the MACD. The MACD slope indicator plots the change in the slope of the MACD signal line. When the slope changes from positive to negative, a red arrow is plotted, possibly indicating prices heading lower. When the slope changes from negative to positive, a green arrow is plotted, possibly indicating higher prices ahead.
MACD Delta
The MACD Delta measures the difference between this periods MACD histogram value and last periods histogram, showing whether it is rising or following.
Momentum
Description
The Momentum indicator is a speed of movement (or rate of change) indicator, that is designed to identify the speed (or strength) of a price movement. Usually, the momentum indicator compares the most recent closing price to a previous closing price, but it can also be used on other indicators such as moving averages. The momentum indicator is usually displayed as a single line, on its own chart, separate from the price bars, and is the bottom section in the example chart (view full size chart).
Calculation
Description: There are several variations of the momentum indicator, but whichever version is used, the momentum (M) is a comparison of the current closing price (CP) and a specific length of the previous closing prices (CPn).
Calculation:
M = CP — CPn
M = (CP / CPn) * 100

The version shown in the example chart is the second version shown above, where the momentum value is the most recent closing price as a percentage of the previous closing price.
Trading Use
The momentum indicator identifies when the price is moving upwards or downwards, and also by how much the price is moving upwards or downwards. When the momentum indicator is above 0 (zero), the price has upwards momentum, and when the momentum indicator is below 0 (zero) the price has downwards momentum. The momentum indicator can be used on its own, or as part of a larger trading system.
1. Volume needs to increase (India our daily share volumes should be couple of million viz. US it about 10Bn / day)
2. Spread (bid/ask ration) has not become so thin as in US markets
3. In the passing decade market venues have increased in US from 2 to something like 40, thus creating the problem of liquidity fragmentation. We still are grappling with 8hr trading window with two exchanges for now forgetting dark pools, ECNs, ATSs
4. One more thing is liquidity moves from one venue to another like a wave across US markets in milli/micro seconds to capture this liquidity we definitely need to move into the realms of HFT, SOR. Algo trading
5. In the literal sense we dont have market markers in the Indian context someone like Madoff securities, Knight capital in the US context are non-existent in our securities market
6. Even in terms of revenue model of the B/D (in US).there is significant pressures on the commission the B/D collect from investors revenue from execution only model has been peeny+ized . While execution+ model has some margin left with them still, as this come with value added services to the investor. So B/D dont want to incur opportunity cost in not liquidating any small spread that may come up in the various market venues
7. Trading strategies have evolved more towards quant models which are beyond the human traders abilitythus crossing over to the Sci-fi region where machines are better than human traders
8. As you have stated volatility is also a contributing factor for the introduction of HFT & Alog trading. To quote, one of the main reason for Algo and HFT to take a lion-share of the trading techniques in the US market, last year(2009) was the high level of volatility in the penny range($0.001) the investors experienced


