Types of Innovation and Design Dominance
Post on: 16 Март, 2015 No Comment

Types and Patterns of Innovation
- Product innovations are embodied by the business outputs goods and services
- Process innovations are innovations in the way business is conducted, such as techniques in marketing or production, to improve efficiency e.g. Reducing defect rate, or increasing output rate
- Product innovations for one organization might be a process innovation for another new distribution service (product innovation) allows its customers to distribute faster (process innovation)
- The difference lies in how far the innovation lies from existing practices
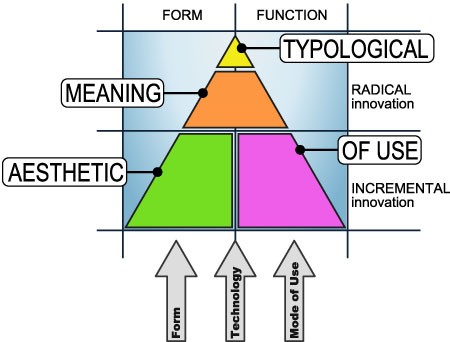
- A radical innovation is like the introduction of the motorized car to replace horse-drawn carriage, whilst the iPhone 4 is an incremental innovation on the iPhone 3
- Radicalness is defined by a combination of newness and the degree of differentness. It is also sometimes defined in terms of risk
Competence Enhancing v Competence Destroying
- Competence enhancing innovation builds on the company’s existing knowledge base
- Competence destroying innovation doesn’t build on the existing knowledge and sometimes renders it obsolete
Architectural Innovation v Component Innovation
- Most products or processes are hierarchal nested systems. This means that at any unit of analysis, the entity is a system of components, and each of these components is a system of smaller components and so on
- Component innovation is the change in the parts that make up the product but don’t have a significant effect on the overall configuration of the system
- Architectural innovation is the change in the overall design of the system or the way that components interact
Technology S-Curves
- The rate of technology’s performance improvement and the rate at which the technology is adopted in the marketplace (rate of diffusion) repeatedly have been shown to conform to an s-shape curve
Technologies do not always get to reach their limits
- May be displaced by new, discontinuous technology
- A discontinuous technology fulfills a similar market need by means of an entirely new knowledge base
- E.g. Switch from carbon copying to photocopying, or vinyl records to compact discs
S-Curves in Technology Diffusion
- Adoption is initially slow because the tech is unfamiliar
- It accelerates as technology becomes better understood
- Eventually market is saturated and rate of new adoptions declines
- Technology diffusion tends to take far longer than information diffusion
- Technology may require acquiring complex knowledge or experience
- Technology may require complementary resources to make it valuable (e.g. Cameras may not be valuable without film)
S-Curves as a Prescriptive Tool
- Managers can use data on investment and performance of their own technologies OR data on overall industry investment and technology performance to map the s-curve
- While mapping the technology’s S-Curve is useful for gaining a deeper understanding of its rate of improvement or limits, its use as a prescriptive tool is limited
- True limits of technology may be unknown
- Shape of s-curve can be influenced by changes in the market, component technologies or complementary technologies
- Firms that follow the s-curve model too closely could end up switching technologies too soon or too late

S-Curves of diffusion are in part a function of s-curves in technology improvement
- Learning curve leads to price drops, which accelerate diffusion
Types of Adopters
- First 2.5% to adopt the innovation
- Adventurous
- Comfortable with a high degree of complexity/uncertainty
- Access to substantial financial resources
Early Adopters
- Next 13.5%
- Well integrated into social system
- Great potential for opinion leadership
- Other potential adopters look to early adopters for information and advice, so these guys are like missionaries for new products and services
- The next 34%
- Adopt innovations slightly before everyone else
- Not really opinion leaders, but peer interaction is frequent
Late Majority
- The next 34%
- Skeptical
- Scarce resources?
- Last 16%
- Base their decisions primarily on past experience and possess almost no opinion leadership
- Highly skeptical
Theory in Action
Technology Trajectories and “Segment Zero”
- Technologies often improve faster than customer requirements demand
- This enables low-end technologies to eventually meet the needs of the mass market
- Thus, if the low-end market is neglected, it can become a breeding ground for powerful competitors
Technological change tends to be cyclical:
Each new S-Curve ushers in an initial period of turbulence, followed by rapid
- Utterback and Abernathy characterized the technology cycle into two phases:
- The fluid phase (when there is considerable uncertainty about the technology and its market; firms experiment with different product designs in this phase
- After a dominant design emerges, the specific phase begins (when firms focus on incremental improvements to the design and manufacturing efficiency)
Standards Battles and Design Dominance
- Many industries experience strong pressure to select a few single dominant designs
- There are multiple dimensions shaping which technology rises to the position of the dominant design
- Firm strategies can influence several of these dimensions, enhancing the likelihood of their technologies rising to dominance
W hy Dominant Designs are Selected
- In markets with network externalities, the benefit from using a good increases with the number of other users of the same good
- Network externalities are common in industries that are physically networked
- E.g. Railroads, telecommunications
Government Regulation
- Sometimes the consumer welfare benefits of having a single dominant design prompts government organizations to intervene, imposing a standard
- General standard of mobile communications in EU (GSM)
Result: The Winner Take All Markets
- Natural monopolies
- Firms supporting winning technologies earn huge rewards; others may be locked out
Increasing returns indicate that technology trajectories are categorized by path dependency :
- End results depend greatly on the events that took place leading up to the outcome
A dominant design can have far-reaching influence; it shapes future technological inquiry in the area
Winner take all markets can have very different competitive dynamics than other markets
- Technologically superior products do not always win
- Such markets require different firm strategies for success than markets with less pressure for a single dominant design
In many increasing returns industries, the value of a technology is strongly influenced by both:
- Technology’s standalone value
- Network externality value
Technology’s Standalone Value
- Includes such factors as:
- The functions the technology enables customers to perform
- Its aesthetic qualities
- Its ease of use
Network Externality Value
- Includes the value created by:
- The size of the technology’s installed base
- The availability of complementary goods
- A new technology that has significantly more standalone functionality than the incumbent technology may offer less overall value because it has a smaller installed base or poor availability of complementary goods
- NeXT Computers were extremely advanced technologically, but couldnt compete with the installed base value and complementary good value of Windows
- To successfully overthrow an existing dominant technology, new technology often must either offer:
- Dramatic technological improvement (e.g. Videogame consoles)
- Compatibility with existing installed base and complements
- Subjective information (perceptions and expectations) can matter as much as objective information (actual numbers)
- Value attributed to each dimension may be disproportional
Competing for Design Dominance in Markets with Network Externalities
- We can graph the value a technology offers in both standalone value and network externality value
- We can compare the graphs of two competing technologies, and identify cumulative market share levels (installed base) that determine which technology yields more value
- When customer requirements for network externality value are satiated at lower levels of market share, more than one dominant design may thrive
Are winner-take-all markets good for consumers?
- Economics emphasizes the benefits of competition
- However, network externalities suggest users sometimes get more value when one technology dominates
- Should the government intervene when network externalities create a natural monopoly
- Network externality benefits to customers rise with cumulative market share
- Potential for monopoly costs to customers


