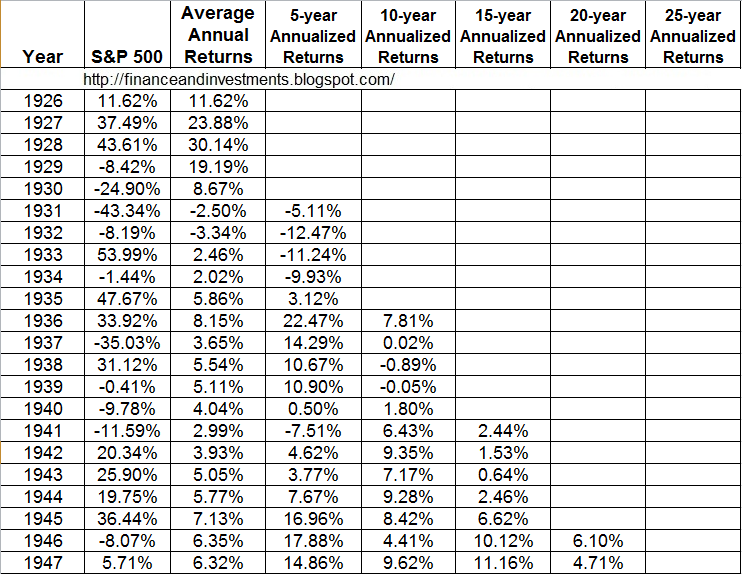
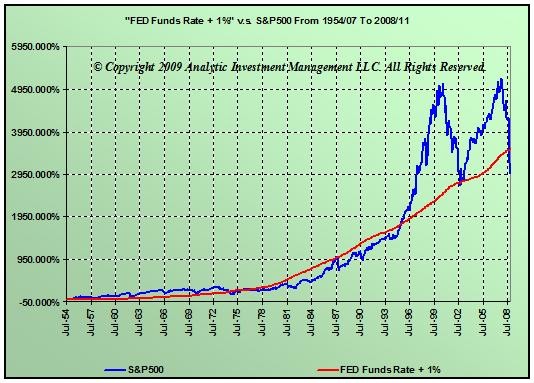
The S P 500 Index Historical Returns
Post on: 22 Август, 2015 No Comment

The S&P 500 is one of the largest barometers of overall stock market performance available; the index is comprised of 500 of the largest and leading companies on the market today. The original S&P index debuted in 1927 with 233 stocks and did not expand to the current 500 companies until 1957. Many investors that seek diversification will look to S&P 500 index mutual funds. By owning the index you spread your funds out across a very large swath of companies.
But before you jump into any investment, even if it is the S&P 500, you should know how it has performed in the past. With the S&P 500 finding the historical rate of return is surprisingly difficult to do.
How to Calculate the Historical Return of the S&P 500
To figure out what the index has returned over a period of time, you need two things: the historical data and the proper math.
The Data
The problem with looking for the historical return of the S&P 500 is finding the actual historical data to run the calculations. Unless you subscribe to a service from Standard and Poors, finding true data can be quite tricky.
There are a few places you can find mostly complete and well presented data:
However, as robust as this data is, you must be careful about the accuracy of some online data. You will find some spreadsheets that date back to the 1870s. Considering the S&P index didnt debut until 1927 and didnt reach 500 companies until 1957, there are assumptions baked into numbers previous to that. Stick with more traditional data for your calculations.
The Math
Once you have the data, you cant necessarily just do an average of all of the returns. There are multiple methodologies you can use: median, mean, compound annual growth rate (CAGR). and so on.
There is a great CAGR calculator available at moneychimp. The CAGR calculator shows you what the simple average is over a given time period and what the more accurate (and usually lower by 1-2%) CAGR for the same time period is. (It should be noted that the returns also include dividend payments as part of the overall return.)
What is the Average Return of the S&P 500?

Utilizing the CAGR method, the average return of the S&P 500 from January 1, 1957 to December 2011 is 9.62%. (This is lower than the simple average of 11.12%.) With a 9.62% return, $1 invested in 1957 would be worth $156.57 today.
Is the S&P 500s return always going to be 9.62%? Absolutely not. The index has had years with a positive return of 43.40% (1958) and others where it dropped 37.22% (2008). What is more important is what it will return during your investment time period, but historical averages are not an indicator of future performance .
On average you should be able to expect a healthy return in the 5-9% range with a long enough investment horizon. However, the CAGR for the last decade (January 2002 to December 2011) is only 2.87%.
Use Dollar Cost Averaging to Avoid Performance Concerns
The natural tendency for the average investor is to get into stocks when prices are going up and jump out of the market when things turn south. This is perfectly opposite of what the smart investor does: buys stocks when they go on sale and sells stocks when they are overpriced.
But it can be hard to know when stocks are over or underpriced. To avoid worrying about what the average return of an index is, simplify your finances by consistently investing into the index with dollar cost averaging. When the S&P 500 soars your money will buy fewer shares than it does when the stock market tanks. Overall you will pay a lower price per share of an index than if you let your emotions drive.
Using dollar cost averaging can help offset poorly performing runs of the stock market. Many performance averages assume you had 100% of your money in the investment at the beginning and end of the period. This is not how investing works for a majority of investors: you build up your assets over time. So while the CAGR of the last decade is just shy of 3%, your performance could be significantly higher if you maintained a sound investing policy of consistent investment.


