Stock Chart Patterns
Post on: 16 Март, 2015 No Comment

Stock Chart Patterns are a group of historical stock prices which together form a recognizable pattern that has occurred on numerous occasions in the past.
Learning about various types and appearances will enable a trader to increase their odds of having profitable trades in many cases.
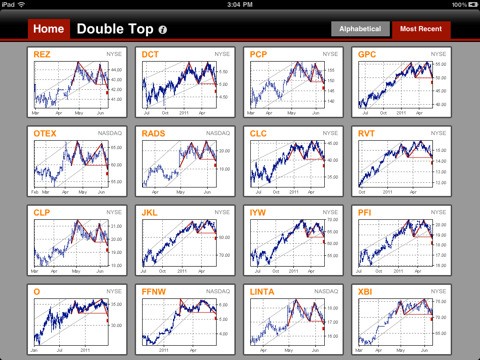
For example, if a Double Top can be seen on a recent chart and is recognized at the beginning of the downtrend off the second top, a high probability trade would be to short at this point.
Not being able to recognize the pattern recently formed, a trader who enters a long position here would be entering into a lower probability trade.
For now, know that understanding stock chart patterns will be another skill which may help with your complete trading plan. This page is an introduction to this topic, and links to specific descriptions and examples will be added for further reference.
Another thing to remember is that the outcome of future price movements from specific chart patterns are not guaranteed. The future price movements can vary, and using cart pattern recognition will only allow you to forecast higher probability outcomes, not guaranteed results.
One of the first things to understand is that there are different categories of Chart Patterns: Continuation Chart Patterns and Reversal Chart Patterns.
- Continuation Pattern:
A Continuation Pattern occurs in the midst of an existing trend or interrupts the existing trend, allows for a pullback of some sort, and then allows the pre-existing trend to continue. These types of patterns imply that once completed, the longer term trend will continue. Reversal Pattern:
A Reversal Pattern occurs at a point of an existing trend in which an extreme is reached, and the trend reverses. These types of patterns imply that once the extreme is reached, the pre-existing trend is finished and an opposite trend will begin.
You’ll notice in the above example that the initial trend from October 2007 was down, then there was a recognizable Continuation Pattern, which led to a continuation of the down trend. Then there was a bottom formed in July 2008 which led to a strong rally only to meet up with resistance. This resistance level was attempted to be broken through several times and failed, which formed a varied Triple Top. This was a short term Reversal Pattern due to the pre-existing rise from around $18.00 in July 2008.
Looking closer, the short term Reversal Pattern which led to lower prices, was also a longer term Continuation Pattern, because the longer term trend was down. This is a little more complex, but illustrates the importance to look at multiple timeframes when analyzing stock chart patterns.
Within each category you’ll find specific chart patterns that can be recognized, each with different possible outcomes based on various situations. Combined with other technical analysis using various types of indicators and stock charts, you’ll likely be recognizing many new patterns and forecasting future price movements in no time at all.


