Sortino ratio A better measure of risk
Post on: 4 Апрель, 2015 No Comment

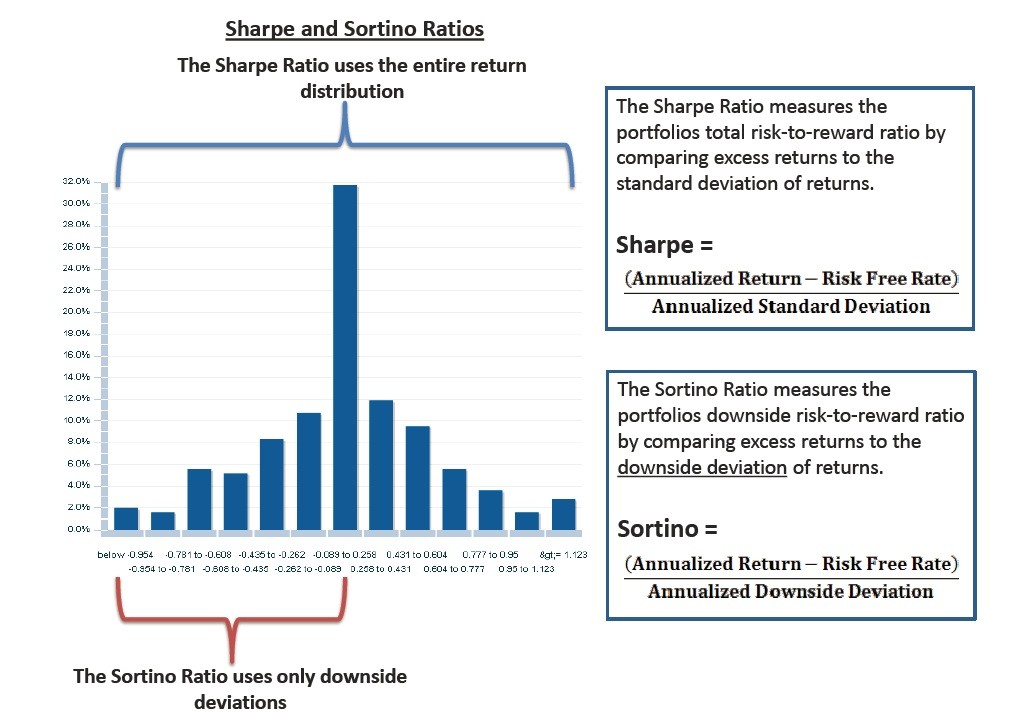
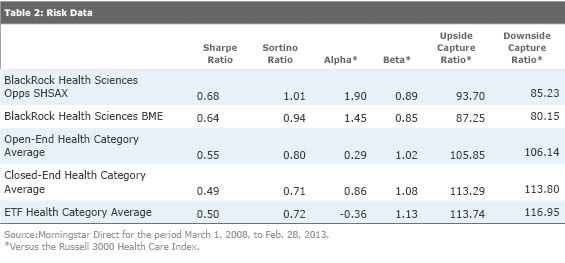
Many traders and investment managers want to measure and compare commodity trading advisors (CTAs) or trading systems. While there are many ways to measure an investments performance, risk-adjusted returns are one of the most important measures to consider because, given the inherent free leverage of the futures markets, more return can be earned by taking more risk. The most popular measure of risk-adjusted performance is the Sharpe ratio. While the Sharpe ratio definitely is the most widely used, it is not without its issues and limitations. Because of the way the Sharpe ratio is calculated, it tends to punish upside volatility in a trading program. We believe the Sortino ratio improves on the Sharpe ratio in a few areas. The purpose of this article is to review the Sortino ratios definition and present how to calculate it properly, because we have seen its calculation often done incorrectly.
The Sharpe ratio is a metric that aims to measure the desirability of an investment by dividing the average period return in excess of the risk-free rate by the standard deviation of the return generating process. Devised in 1966 by Stanford Finance Professor William F. Sharpe as a measure of performance for mutual funds, it undoubtedly has some value as a measure of investment quality, but it has a few limitations also.
The most glaring flaw is that it does not distinguish between upside and downside volatility (see Good news, bad news, below). In fact, high outlier returns can have the effect of increasing the value of the denominator (standard deviation) more than the value of the numerator, thereby lowering the value of the ratio. For some positively skewed return distributions such as that of a typical trend-following CTA strategy, the Sharpe ratio can be increased by removing the largest positive returns. This is nonsensical because investors generally welcome large positive returns.

Additionally, to the extent that the distribution of returns is non-normal, the Sharpe ratio falls short. It is a particularly poor performance metric when comparing positively skewed strategies like trend-following to negatively skewed strategies like option selling (see Bigger winners vs. more winners, below). In fact, for positively skewed return distributions, performance actually is achieved with less risk than the Sharpe ratio suggests. Conversely, standard deviation understates risk for negatively skewed return distributions, i.e. the strategy actually is more risky than the Sharpe ratio suggests. Typical long-term, trend-following CTAs, especially those with longer track records, generally have Sharpe ratios in the 0.50 0.90 range. However, negatively skewed programs (convergent strategies) like option writing will produce high Sharpe ratios, 3.0 and above, up until a devastating drawdown. The Sharpe ratio often misses the inherent risk of convergent strategies.


