Sensex Total Returns Index as a Mutual Fund Benchmark
Post on: 18 Апрель, 2015 No Comment

Recently I had posted an analysis of Franklin Indian Blue Chip fund (FIBCF). In response, Swapnil suggested that I compare the fund with Sensex or Nifty including dividends.
In the same post, I was able to include a comparison with the Nifty total returns index, as the data is conveniently available (as Swapnil pointed out).
In this post, I compare FIBCF with Sensex total returns index and discuss a couple of things I realised while making graphs for the post on Visualizing Mutual Fund Volatility Measures
As pointed out by Mr. Bharat shah in the above-mentioned post, Quantum Long Term Equity is benchmarked against Sensex total returns, while FIBCF is benchmarked against Sensex. I will take up QLTE in a separate post.
This post is possible because of two kind friends who sent me Sensex total returns index data: Sridhar Vetapalem and Yogesh Sundaram.
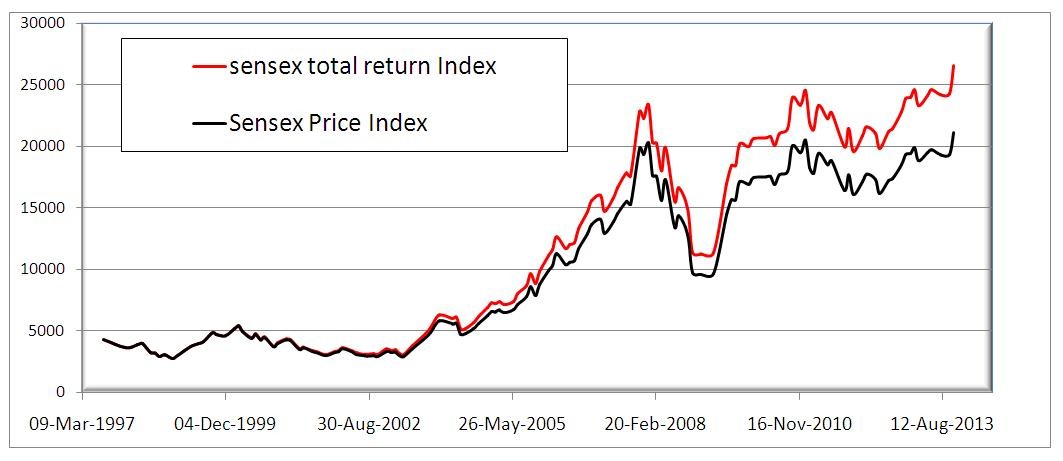
Sensex Total returns index is an interesting choice as a benchmark because when you include dividends to an index, the difference is significant (and obviously on the higher side!) over a long period. Have a look.
Notice that difference widens with time. Only monthly data is available for the Sensex total returns index. Therefore, the curves appear smoother than they actually are!
In general, it would be easier for a fund to beat the Sensex price index than the Sensex total returns index. Therefore, it is indeed commendable of QLTE to choose the returns index as its benchmark.
Note about dividends: When returns are calculated after including dividends, long terms returns are higher by a minimum of 2%. More details and a calculator can be obtained from this post: Understanding the Nature of Stock Market Returns
FIBCF vs. Sensex
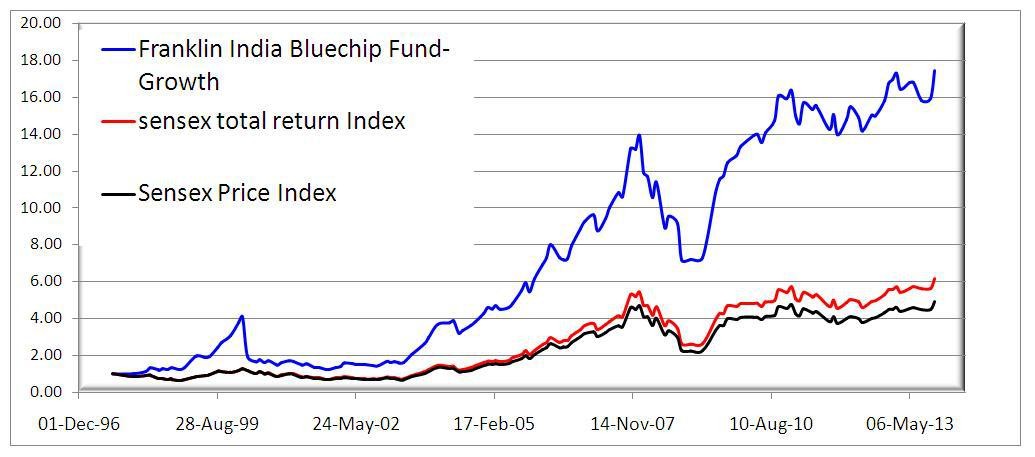
When we look at the performance from Aug. 1997 to Oct. 2013, it is obvious that FIBCF towers over both the indices.
Rolling returns analysis over 1-year periods for the same duration as above reveals the likely reason for this stellar outperformance.
First notice how the red and black curves are identical. Therefore, the difference in returns including dividends is not significant over 1-year periods, which is of course obvious.
Now notice, the two regions where the fund (blue curve) towers over the indices. FIBCF outperformed the indices significantly in early 1998 and the crashed in 2000, possibly its biggest ever crash poorly correlated with the Sensex. The NAV which was 56.92 on Feb. 29 th 2000, crashed to 27.47 on March 31 st 2000, quite possibly because of the dot-com bubble (?)
After the Harshad Mehta scam in 1992, the Sensex was listless and a sideways market ensued for almost a decade. In this period, FIBCF steadily outperformed the Sensex.
Therefore, although FIBCF crashed in 2000, it had built up enough distance from the Sensex, that even after the crash, it was above the Sensex (first picture).
In mid-2003, the great India stock bull run began, lasting up to Jan. 2008. Again, FIBCF charted its own course and leapt above the Sensex.
The huge difference that you see between the fund and indices today since inception is primarily because of the huge gains made during these outperformance pockets.

Now the question is, what if I have missed these pockets? That is, what if I had invested in, say Jan. 2004?
Until early 2010, FIBCF had just about kept pace with the indices, marginally falling below the total returns index at certain times. However, after the 2008 crash, the fund has recovered and beat the indices quite comfortably. Notice the short spike after Aug. 2013. Hopefully it will continue!
This is how the one-year rolling returns look
I would think that is decent, if not spectacular.
Bottom line: At the start of each recovery, at the start of each bull run, FIBCF has performed admirably by quickly beating the indices. Therefore, it remains a compelling pick and pays the patient and disciplined investor handsomely.
If you need proof, have a look at the 7-year rolling returns in the same period and other graphs here: Mutual Fund Rolling Returns Analysis: Franklin India Blue Chip Fund
Note: My main aim in writing such posts is to encourage readers to use my automated rolling returns calculator for analysing mutual funds. This is the best way to understand how consistent the funds performance has been with respect to a benchmark. I will soon compare other funds with the total returns index.
What are your impressions when you look at these graphs? Can you suggest alternative time periods (between Aug. 1997 to Oct. 2013) for analysis? I will be happy to include them in the same post.
Do you know any other funds which are benchmarked with respect to a total returns index?
Download the Sensex Total Returns vs. FIBCF Rolling Returns Analyzer


