Section 5 Mutual Fund Fees and Expenses
Post on: 29 Март, 2015 No Comment

To understand trends in mutual fund fees and expenses, it is helpful to combine major fund fees and expenses into a single measure. ICI created such a measure by adding a funds annual expense ratio to an estimate of the annualized cost that investors pay for one-time sales loads. This measure gives more weight to those funds that have the most assets.
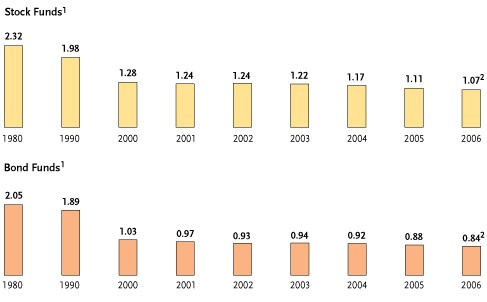
Mutual fund fees and expenses that investors pay have trended downward since 1980. In 1980, investors in stock funds, on average, paid fees and expenses of 2.32 percent of fund assets. By 2008, that figure had fallen by almost 60 percent to 0.99 percent (Figure 5.1 ). Fees and expenses paid on bond funds have declined by a similar amount.
FIGURE 5.1
Fees and Expenses Incurred by Stock and Bond Mutual Fund Investors Have Declined Since 1980
Percent, selected years
Download an Excel file of this data.
*Variable annuities and mutual funds that invest primarily in other mutual funds are excluded. Figure reports asset-weighted average of annual expense ratios and annualized loads for individual funds.
Sources: Investment Company Institute; Lipper; ValueLine Publishing, Inc.; CDA/Wiesenberger Investment Companies Service; Data CRSP University of Chicago, used with permission, all rights reserved (312.263.6400/www.crsp.com ); and Strategic Insight Simfund
There are several reasons for the dramatic drop in the fees and expenses incurred by mutual fund investors. First, investors generally pay much less in sales loads than they did in 1980. For example, the maximum front load that an investor might pay for investing in an equity fund has fallen from an average of 7.9 percent of the investment in 1980 to 5.3 percent in 2008. The front-end loads that equity fund shareholders actually paid have fallen even more, from 5.5 percent in 1980 to only 1.1 percent in 2008. A key factor in the steep decline in loads paid has been the growth of mutual fund sales through employer-sponsored retirement plans. Load funds often do not charge loads for purchases of fund shares through such retirement plans.
Another reason for the decline in the fees and expenses of investing in mutual funds has been the growth in sales of no-load funds. Much of the increase in sales of no-load funds has occurred through the employer-sponsored retirement plan market. Sales of no-load funds have also expanded through mutual fund supermarkets and discount brokers.
Finally, mutual fund fees have been pushed down by economies of scale and competition within the mutual fund industry. The demand for mutual fund services has increased dramatically since 1980. From 1980 to 2008, the number of households owning mutual funds rose from 4.6 million to 52.5 million, and the number of shareholder accounts rose from just 12 million to about 265 million. Ordinarily, such a sharp increase in the demand for fund services would have tended to limit decreases in fund expense ratios. This effect, however, was more than offset by the downward pressure on fund expense ratios from competition among existing fund sponsors, the entry of new fund sponsors into the industry, economies of scale resulting from the growth in fund assets, and shareholder demand for lower cost funds.
Focusing only on fund expense ratios, ICI research still indicates that mutual fund shareholders invest predominantly in low-cost funds. This can be seen by comparing the average expense ratio on mutual funds offered in the marketplace with the average expense ratio mutual fund shareholders actually paid (Figure 5.2 ). The simple average expense ratio of stock funds (which measures the average expense ratio of all stock funds offered in the market) was 1.44 percent in 2008. The average expense ratio that stock fund shareholders actually paid (the asset-weighted average expense ratio across all stock funds) was considerably lower: just 0.84 percent of stock fund assets. Thus, investors actually paid expense ratios at the lower end of the range of funds available in the market.
FIGURE 5.2
Fund Shareholders PaID Lower-Than-Average Expense ratios in
Stock Funds 1
19942008
Download an Excel file of this data.
1 Variable annuities and mutual funds that invest primarily in other mutual funds are excluded.
2 Figure reports asset-weighted average of annual expense ratios for individual funds.
Sources: Investment Company Institute; Lipper; ValueLine Publishing, Inc.; CDA/Wiesenberger Investment Companies Service; Data CRSP University of Chicago, used with permission, all rights reserved (312.263.6400/www.crsp.com ); and Strategic Insight Simfund
Another way to illustrate that investors demand mutual funds with low expense ratios is to identify how investors allocate their new purchases of mutual fund shares. During the 10-year period from 1999 to 2008, more than 100 percent of the new cash flowing to stock funds went to those funds whose expense ratios were below average, while funds with above average expense ratios as a
group experienced outflows (Figure 5.3 ). This was true for both actively managed funds and index mutual funds.
FIGURE 5.3
Stock Funds with Below-Average Expense Ratios ReceiveD 102 Percent of Net New Cash*
Percentage, 19992008
Download an Excel file of this data.
*Variable annuities and mutual funds that invest primarily in other mutual funds are excluded.
Sources: Investment Company Institute; Lipper; ValueLine Publishing, Inc.; CDA/Wiesenberger Investment Companies Service; Data CRSP University of Chicago, used with permission, all rights reserved (312.263.6400/www.crsp.com ); and Strategic Insight Simfund
As is true of the prices of most goods and services, fees differ considerably across the range of mutual funds (Figure 5.4 ). The level of fund fees depends on the fund investment objective, fund assets, balances in shareholder accounts, the number and kinds of services that a fund offers, and other factors.


