Relative Strength StockRanking System Shown to Deliver MarketBeating Returns
Post on: 1 Май, 2016 No Comment

Within a group of different stocks, mutual funds or any other possible investments, some will perform better than others. Relative strength (RS) recognizes those differences in performance and is a way to rank investments from the strongest (best performers) to the weakest (poor performers).
As the name implies, relative strength ranks relative performance. It is important to remember that beating the market will give an investment a high relative strength rank, even though beating the market can mean losing less than average in a bear market.
Long-term investors can think of the stock market as a marathon race. Marathon runners cover more than 26 miles. If given the chance to bet on the eventual winner with only a mile to go in the race, most people would bet on one of the front-runners since there is little chance that someone three miles from the finish line at that point could be the winner. The front-runners have put in a strong performance and are likely to continue outperforming.
Stocks show a similar pattern of behavior — the strongest performers have a tendency to continue performing well. High relative strength investments are likely to show continued strength and low relative strength investments, the ones that have failed to keep up with the market in the past, often continue underperforming.
How Traders Use It
Traders often buy strong stocks and sell weak stocks. This is a widely used strategy. Relative strength can be calculated as the rate of change or with a number of other indicators. Relative strength is different from the Relative Strength Index (RSI), which is calculated for an individual investment. Relative strength is always calculated for a group of investments, comparing the performance of a particular investment to all other investments.
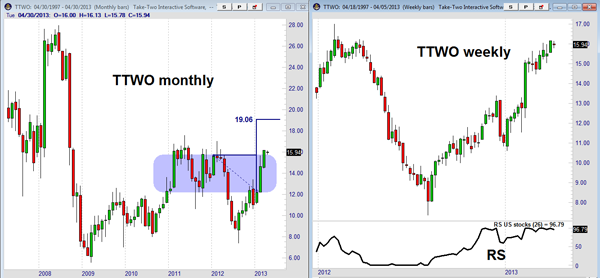
Some traders will only buy stocks that are stronger than the market. In the example below, relative strength is calculated using all publicly traded stocks over the past six months. The strongest stock has a rank of 100 and the weakest are 0.
Soda maker Monster Beverage Corp. (NASDAQ: MNST ), formerly known as Hansens Natural, has been one of the biggest stock market winners in history, with a gain of more than 18,000% between 2003 and 2011. Traders could have captured nearly all of the gains by only owning the stock when the relative strength rank was above 50, indicating the stock was performing better than average when compared to all other investments.

Why It Matters To Traders
A number of academic studies have shown that relative strength strategies can deliver market-beating returns. Many successful strategies include relative strength as part of the selection process. Examples include the CAN SLIM methodology popularized by Investors Business Daily and the Timeliness Ranking System included in the Value Line Investment Survey.
Relative strength can be used as a complete trading strategy by professionals and by individual traders as well. Individuals could actively manage their 401(k) accounts by calculating the six-month rate of change for each available investment once a month and investing in only the three highest ranked options. Over the long term, this could lead to market-beating results and a more financially secure retirement.


