Relative Strength Index Spreadsheet
Post on: 16 Март, 2015 No Comment

The Relative Strength Index helps you decide if a stock is overbought or oversold. Learn about it, and get an Excel spreadsheet that calculates RSI of a stock based on its ticker symbol.
The momentum of the stock market is rather like a ball thats thrown upwards. Once the ball is thrown, it keeps on going until it reaches its apex, and then it starts falling. The principles that physicists employ to measure the velocity and acceleration of the ball are similar to those use to gauge price action.
Stock market momentum is measured by several techniques, and the Relative Strength Index (or RSI) is one of the most popular. Its a momentum-based oscillator and is a widely used technical analysis tool. It was introduced by J. Wells Wilder in New Concepts In Trading Systems. RSI compares recent upwards movements to recent downwards movements in the closing price of a stock.
How to Calculate Relative Strength Index
RSI is defined by this equation.
where RS is the Relative Strength Factor. RS is a moving average this is either an exponential moving average, or an equally-weighted mean. The averaging window is usually 14 days, but is sometimes more or less. Assuming an equally-weighted mean, the initial value of RS is calculated as follows.
- First average gain: looking back over the previous two weeks, you note those days in which the stock has finished up. You calculate the average gain over all of these days.
- First average loss: looking back over the previous two weeks, you note those days in which the stock has finished down. You calculate the average loss over all of these days.
The first value of RS is the first average gain divided by the first average loss.
- All other values of average gain: [(previous average gain × 13 + current gain) / 14]
- All other values of average loss: [(previous average loss × 13 + current loss) / 14]

All other values of RS are simply the first value divided by the second value.
The moving average smooths the impact of large price movements
How Do You Interpret Relative Strength Index?
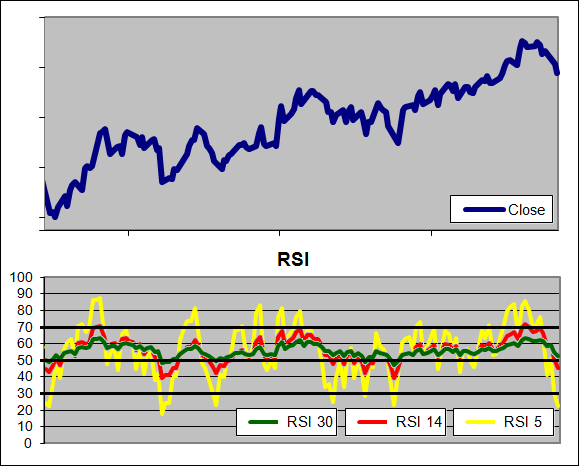
RSI varies between 0 and 100. A stock is generally considered overbought if RSI moves above 70, or oversold if its RSI moves below 30.
If the stock price reaches new highs, but the RSI does not rise above its previous high, then the stock price is due to fall.
When the RSI move above 50, the average gains outweigh the average losses; this is regarded as bullish. When the RSI falls below 50, the average losses outweigh the average gains; this is regarded as bearish.
Lets look at a specific example of how RSI can be used to generate buy and sell signals. This chart gives the share price and RSI of BP for the 90 days from 3rd January 2011.
At around 38 days, the RSI touches 30. This generates a buy signal and the share price rebounds upwards as buyers enter the market.
Calculate Relative Strength Index in Excel
This Excel spreadsheet demonstrates how you can calculate RSI
The spreadsheet uses data for BP from 3 rd January 2011 to 27 th May 2011 (which was retrieved with this spreadsheet), and implements the calculation steps given above. All the calculations are manual.
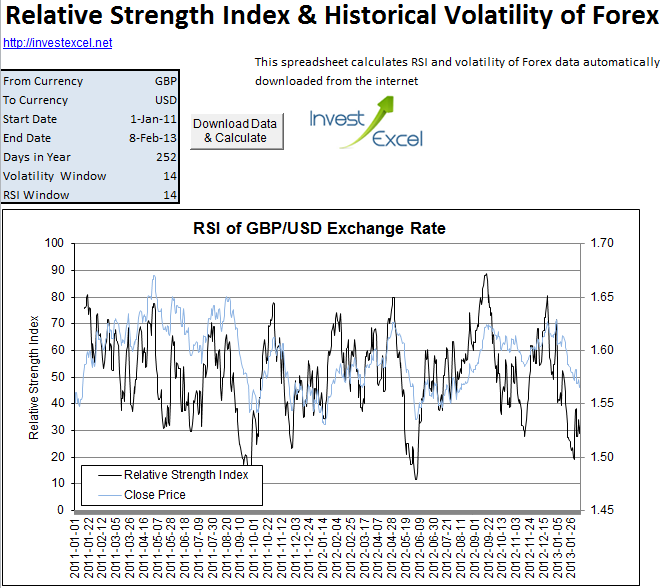
This spreadsheet, however, is a lot more clever. It automatically calculates and plots RSI based on data downloaded from Yahoo Finance. It also plots the Average True Range. MACD. 12- and 26 day EMA. and the historical volatility .
Simply type in a stock ticker, two dates, and the number of days in averaging period. After you click a button, the spreadsheet downloads stock quotes from Yahoo finance, and then calculates and plots RSI and ATR. As a bonus, it also plots the historical volatility. Everything is automated in VBA.


