Presidential Election Cycle Definition and Indicator
Post on: 25 Апрель, 2015 No Comment

Theory, Definition & How the Stock Market Indicator Works
You can opt-out at any time.
History reveals there is some relevance to this stock market indicator but investors should be cautious in applying the Presidential Election Cycle to their investment strategies.
Definition:
The Presidential Election Cycle is theory first developed by a stock market historian named Yale Hirsch. The theory evolved to be used as a market timing indicator for stock investors.
How the Presidential Election Cycle Indicator Works
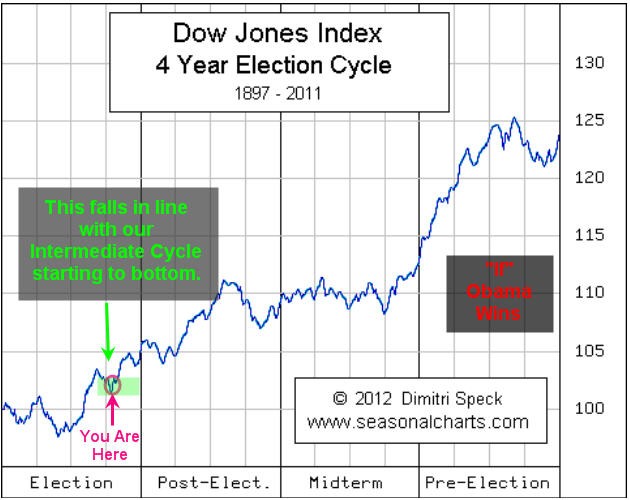
Here are the fundamental assumptions, in relation to stock market performance, for each of the four years of a US President:
History and Accuracy of the Presidential Election Cycle
To summarize the stock market performance aspect of the Presidential Election Cycle Theory, the performance of stocks, ranked from the best year to the worst, is third year, fourth year, second year and first year.

Caution to Investors
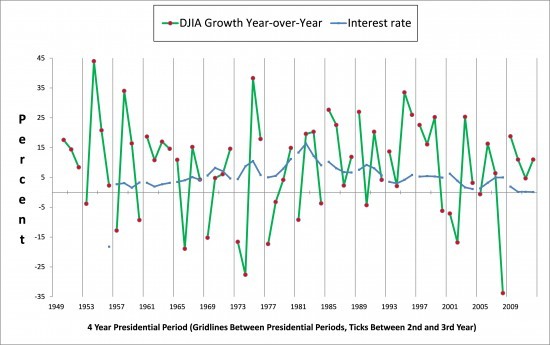
As with any market timing strategy, the overall pattern of investment performance related to the Presidential Election Cycle may be convincing but the pattern is based upon averages and averages do not guarantee consistent results. For example, stock market performance in the first two years of Barack Obama’s presidency were much stronger than his third year. Also, George H.W. Bush’s first year was much stronger than his third and fourth and Bill Clinton had strong first years in both of his terms.
A wise investor will consider the Presidential Election Cycle as only one of many factors influencing economic and market conditions. Certainly politics do play a role in financial markets and the legislation passed in Congress (often originating from a sitting President’s legislative agenda) does have significant impact on corporate earnings. However, the timing of any given year of a sitting President’s term is just one factor influencing market risk. which can include world economic conditions, interest rates, investor psychology, and weather.
The overriding caution with using any timing strategy is that the strategy is not ever reliable enough to remove market risk. which exists primarily due to the random and unforeseeable nature of economic and market conditions. This is a classic example of the folly of confusing causation with correlation — some of the overall stock market returns are attributable to political activities but much of the relationship between the President’s actions (or inaction) is coincidental. In fact, there have been correlations found between the winner of the Super Bowl and stock market performance. Can a football team influence the stock market? Perhaps not as much as a US President but you get the idea: Don’t bet the farm on a pattern. At the same time, a prudent investor wouldn’t bet against remarkable patterns either.
While history does show that the third year of a President’s term has been, on average, better for stocks than the first year of the presidency, the key phrase is on average. There is never any promise that every presidential term is average. Furthermore, the President of the United States does not have enough power to control the global political environment.
Similarly, investors have no means of controlling the investment returns of their stock mutual funds on a year-to-year basis. The greatest determinant of a mutual fund portfolio’s return is asset allocation — not the year of a President’s term.
Disclaimer:
The information on this site is provided for discussion purposes only, and should not be misconstrued as investment advice. Under no circumstances does this information represent a recommendation to buy or sell securities.


