MACD Histogram and momentum divergence Technical Analysis Education
Post on: 16 Март, 2015 No Comment

Despite the U.S. national debt, there is a silver lining for income investors. This massive spending, combined with movement out of U.S. Treasuries, is going to take its toll on the dollar, and international income investors could reap the rewards in the form of higher dividends.
MACD AND MOMENTUM DIVERGENCE
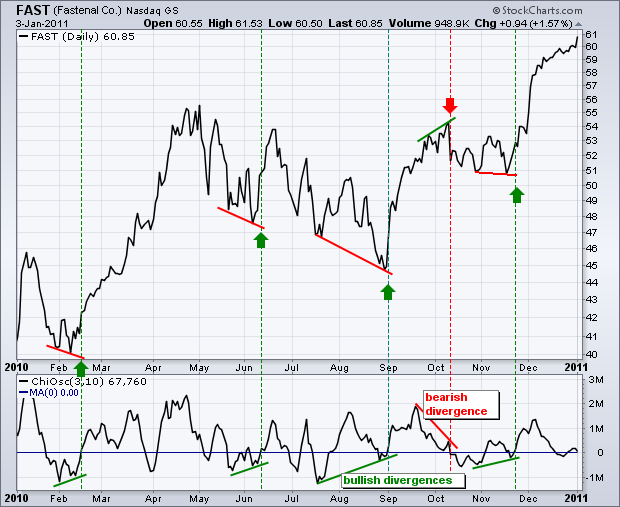
In a recent newsletter I noted that the MACD histogram could have bullish or bearish divergence. In addition, I pointed out that MACD itself could also be used as a momentum divergence indicator.
We have all heard of momentum traders who buy high and sell higher. But what is momentum? Momentum can be described as the velocity or rate of acceleration of a price movement.
My experience in teaching this concept is that while it is easy to define, in practice it is one of the most difficult ideas in technical analysis to clearly grasp. One helpful idea is to think of this analogy — throwing a ball into the air. When you first throw the ball and it leaves your hand, its velocity and acceleration is very rapid. However, as it rises, it gradually loses momentum. At its peak, the ball has a brief moment of equilibrium — it is neither moving higher nor lower. Gradually, it begins to descend back to the ground. The momentum as it falls then becomes increasingly negative.
Perhaps one of the best ways to grasp momentum is to go through the calculation for momentum’s cousin — the rate of change indicator . Whereas momentum is calculated through subtraction, the rate of change indicator is a ratio whose main mathematical function is division.
The formula for rate of change is:
((Today’s Close — Close n periods ago)/ Close n periods ago) x 100
where n = number of periods
Let’s take a simple example to illustrate this formula. Imagine we are calculating a four-period momentum indicator. In our example, a fictional stock called MomentumPlay.com closed at $4 on day one and has advanced to $11 by day four. The calculation would be ((11-4)/4) x 100 = (7/4) x 100 = 175.
I continue the story of MomentumPlay.com in the table and graph below:
Day Price Momentum Reading
1 4.00 *
2 8.00 *
3 10.00 *
4 11.00 175
5 11.50 43.8
6 11.75 17.5
7 11.88 8
Note that on days five through seven, MomentumPlay.com is rising in price, but is losing momentum. Its rate of acceleration is decreasing. This is because even through the stock is still moving higher, each incremental increase in price is smaller than the one before it. On day eight, when the stock declines, momentum turns negative and falls below the zero line. This change takes place even through the shares have nearly tripled over the previous eight days!
One of the most important principles in technical analysis is that momentum peaks before price. In other words, momentum provides a warning that a decline in the share price may be imminent. The longer the period of time the momentum weakness, the more likely it is that the shares will ultimately decline.
Because MACD involves a faster (12-period) and slower (26-period) moving average, it functions as a momentum indicator. When a stock is moving higher, then the rate of change of the 12-period moving average is greater than that of the 26-period moving average. The reverse is also true.
To help illustrate this, I’ve presented a weekly chart of Lennar (LEN), a home building company, below. Note that during the strong momentum period of December 2001 to March 2002, when the shares rallied from $37 to over $55, the slope of the 12-period moving average was quite a bit steeper than that of the 26-period moving average.
When the stock hit its final high in June 2002, the rate of change on the 12-period moving average was roughly the same as that of the 26-period M.A. Despite the new high, the shares were losing momentum.
Lennar’s negative momentum divergence is shown clearly in the weekly chart. Although the stock has continued to trade in a very narrow range between essentially $50 and $55, each high on the MACD indicator has been lower. You can see this clearly by the trend drawn on the MACD indicator below.
When price goes higher or stays the same and the MACD hits lower lows, then a condition of negative or bearish divergence exists. Such divergence often foreshadows a large drop in the share price. Therefore, Lennar should be watched carefully as a possible short candidate.
As I stated in our Inside The Black Box section two weeks ago, if weekly MACD is negative, then the trigger for a short sale would be a negative crossover in the daily MACD when confirmed by several other technical indicators. As the daily chart shows, the daily histogram has begun to weaken.
A crossover of the zero line would be convincing evidence to me that LEN was about to retest its early March lows around $47.
MACD, the MACD histogram, the combination of the weekly and daily signals and the analysis of divergence are keys to effective swing trading. They are among the most important technical tools in the swing trader’s toolkit.


