Learning to Invest in the Stock Market How to Trade the Bullish Engulfing Candlestick Signal
Post on: 16 Март, 2015 No Comment

Learning to Invest in the Stock Market Using the Bullish Engulfing Signal
Learning to invest in the stock market is a difficult process. There are multitudes of sources that will give their opinions on how to invest. For the person that is just learning to invest in the stock market, the massive amount of information can be overwhelming. Becoming educated in investing should be narrowed down to one basic premise. What investment programs should I utilize that fit my investment risk factors? Learning to invest in the stock market not only includes finding an investment program that fits ones investment nature, but also finding a program that produces the results an investor expects.
Utilizing candlestick signals makes learning to invest in a stock market much easier to understand. The 12 major signals found in candlestick analysis not only reveal high probability reversal situations but understanding the psychology that formed those signals makes understanding why reversals occur much easier to comprehend. One of the fastest and easiest processes for learning to invest in the stock market is learning the candlestick signals. Each major signal provides an immense amount of information.
A Bullish Engulfing signal is one of the major signals. When the elements out of a Bullish Engulfing signal are broken down, an investor can clearly understand what was going on in investor sentiment to cause a reversal. 400 years of observations from Japanese Rice traders has recognized the Bullish Engulfing signal as a very high probability reversal signal.
BULLISH ENGULFING PATTERN
Description
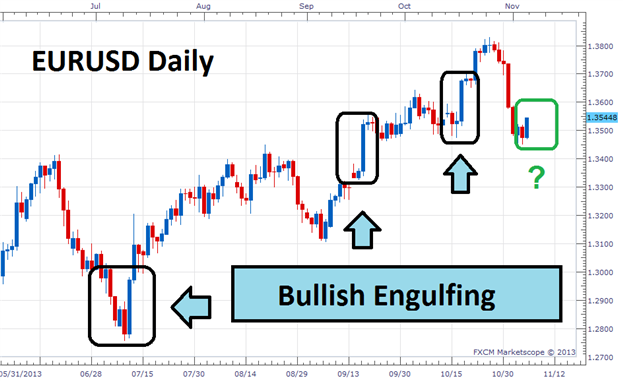
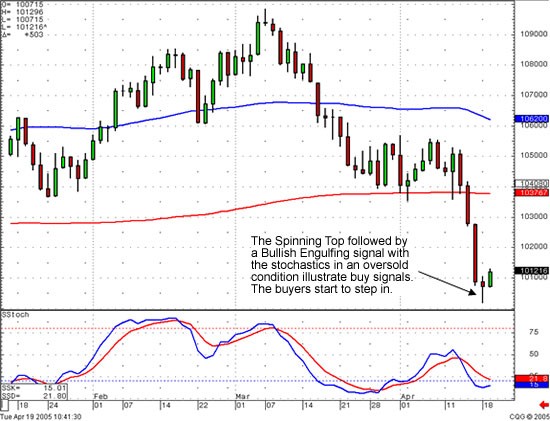
The Engulfing pattern is a major reversal pattern comprised of two opposite colored bodies. The Bullish Engulfing Pattern formed after a downtrend. It opens lower that the previous day’s close and closes higher than the previous day’s open. Thus, the white candle completely engulfs the previous day’s black candle.
Criteria
1. The body of the second day completely engulfs the body of the first day. Shadows are not a consideration.
2. Prices have been in a definable down trend, even if it has been short term.
3. The body of the second candle is opposite color of the first candle, the first candle being the color of the previous trend. The exception to this rule is when the engulfed body is a doji or an extremely small body.

Signal Enhancements
- A large body engulfing a small body. The previous day shows the trend was running out of steam. The large body shows that the new direction has started with good force.
- When the engulfing pattern occurs after a fast move down, there will be less supply of stock to slow down the reversal move. A fast move makes a stock price over extended and increases the potential for profit taking.
- Large volume on the engulfing day increases the chances that a blowoff day has occurred.
- The engulfing body engulfs the body and the shadows of the previous day, the reversal has a greater probability of working.
- The greater the open gaps down from the previous close, the greater the probability of a strong reversal.
Pattern Psychology
After a downtrend has been in effect, the price opens lower than where it closed the previous day. Before the end of the day, the buyers have taken over and moved the price above where it opened the day before. The emotional psychology of the trend has now been altered.
20Engulf%20Chart%20for%20New%20Resources%20copy.jpg /%


