Hussman Funds Research & Insight Average Gain in Year Two of Presidential Cycle Hides Important
Post on: 16 Март, 2015 No Comment

Average Gain in Year Two of Presidential Cycle Hides Important Declines
William Hester, CFA
December 2005
All rights reserved and actively enforced.
The Presidential Cycle is an investing strategy that shouldn’t work. It’s well known and well researched. It’s easy to spot and easy to invest in. In other words it has all of the characteristics that many once-working anomalies have.
It’s anybody’s guess whether it will continue, but for the past three years the stock market has stuck to the script. The S&P rose strongly in 2003 – the third year of the cycle — and more moderately in 2004. This year’s positive but below-average gains mirror past patterns too.
So it might be worth looking more closely at the average returns for the second year of a president’s term. And does breaking down the performance of the stock market during the year highlight any important trends?
Second and Third-Year Stats
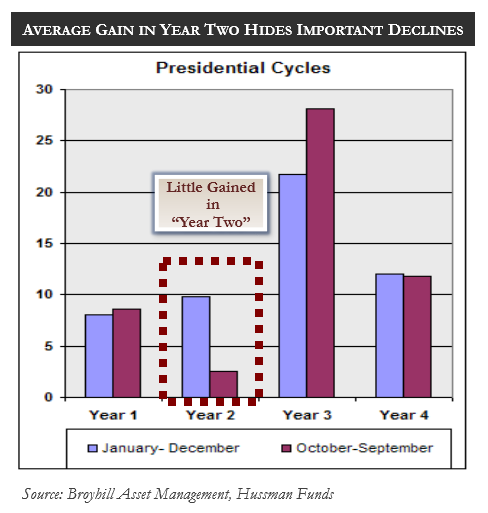
Like roller coasters and formula pop songs, the Presidential Cycle starts slow, builds, peaks, and then moderates. The average total return in year one has been 8 percent followed by 9.8 percent, 21.7 percent and 12 percent. Third-year stats have been especially impressive. The return has historically been more than double the average return in either years one and two and the S&P has finished down only once in those 18 years (all figures are based on total return).
There’s no guarantee that these aren’t just random patterns, but it’s often thought that third-year gains are a result of stimulus being added to the economy as Election Day approaches. It seems like a good time to prime the pump to put voters in a better mood. By 2003, for example, personal tax rates had been lowered, corporate dividend tax rates cut, and the Federal Reserve had lowered interest rates 12 times.
But third-year returns must follow second-year results, and that’s sometimes a problem. The average second-year return of 9.8 percent isn’t bad. Plus, 61 percent of those years have had gains. But digging deeper into the data highlights two trends. One is that the results of the first 9 months of each second year have differed greatly. Also, in many years most of the second-year gains come in the fourth quarter.
If we split year two of the Presidential Cycle into two periods – the first nine months of the year compared with the final quarter — the patterns become apparent. The average market performance during the period from January through September of each second year of the Presidential Cycle has been roughly flat since 1933. The market has been down during these periods nearly as much as it’s been up.
Things have usually been more interesting in the fourth quarter, where the average gain has been 8.7 percent. This is the highest average fourth-quarter return of any of the four years of the cycle, including the last quarter of year three and year four. The fourth quarter of the second year is actually where many third-year rallies are born.
Second Year: January through September
The histogram below shows how each year – based on returns from January through September – would fall along a spectrum. It shows that there have been a few very strong January to September periods. The strongest gains came during the 1950’s bull market. It also shows a number of steep declines. The declines read like a Who’s Who of bear markets: 1962, 1974, and 2002. Of all of the January through September periods since 1933, six of the 10 worst performances have occurred in the second year of the Presidential Cycle.
Importantly, valuation mattered in both tails of the distribution. Entering the 1973-1974 decline, the market traded at 19 times peak earnings. The average price-to-peak earnings ratio was 18.2 for the six periods that delivered losses of at least 10 percent. In contrast, the average Price/Peak Earnings Ratio at the beginning of the three strongest second-year periods was 8.9.
Second Year: October through December

Relief rallies improved the results of many second years that began badly. In 1962 the S&P shed nearly 20 percent through September, and then rallied 15 percent in the last quarter. In 1974, the market lost more than 30 percent through the third-quarter, and then rose 10 percent in the final quarter (though the S&P 500 was still down more than 25 percent on the year).
These relief rallies gave the fourth quarter of year two strong relative results. The histogram below shows each October through December period since 1933. Look at the far right column. Thirteen fourth quarters enjoyed a total return of greater than 10 percent. Seven of those belong to year 2 of the Presidential Cycle. Many followed market troughs that occurred earlier in the year, including 1962, 1982, and 1998.
But second year fourth-quarter results weren’t driven by relief rallies alone. Also in the last column are the years from the 1950’s bull market. The 1954 and 1958 rallies occurred throughout the full year and ended up being two of the best years on record based on total return.
There’s one more trend worth highlighting. The years that have an asterisk next to them, but are not in bold font, are the returns of the fourth quarters of year three. Two years join the ranks of the best performing fourth quarters: 1935 and 1999. That makes nine of the best thirteen fourth quarters since 1933 either second or third years.
But the real standout has been the fourth quarter of year two, which has delivered results more like the typically strong first three quarters of year three. In fact, if we shift the Presidential Cycle one quarter forward, third-year returns jump even higher. The 12-month period beginning in October of the second year of the presidential term has enjoyed average total returns of more than 28 percent, on average. And since 1933, not a single third year 12-month period beginning in October has registered a loss (the worst return was a gain of 6.6 percent).
In the chart below, the blue bar is the calendar year return at any point in the Presidential Cycle, while the red bar is the return as measured from October of the prior year through September of the year noted. So for example, the poorest return has historically been from October of year 1 through September of year 2, a period that the market has just entered.
There’s no doubt that the Presidential Cycle can offer up results that contradict long-term averages, and probably will again. Year 1’s do boom and year 3’s can bust (even if rarely). Also, it’s generally true that seasonal effects don’t override the implications of the prevailing Market Climate, but they do tend to reinforce them. So for instance, negative seasonal patterns tend to make unfavorable Market Climates even worse, on average, while positive seasonal patterns tend to make favorable Market Climates even better, on average. Finally, as noted earlier, valuations also play a role, particularly in the January – September stretch of Year 2. Given that the Market Climate appeared unfavorable and valuations remained rich as of early December 2005, seasonal factors may take on some added interest in the coming months.


