How to use XIRR in Excel to calculate annualized returns
Post on: 16 Март, 2015 No Comment

Corporate finance. Excel function tutorials. Personal finance
Ive previously created a spreadsheet for calculating compound annual growth rates (CAGR) as well as an online CAGR calculator. but these arent always the tools you need when trying to calculate your returns.
In fact, the two CAGR tools I created really only work when you have one initial amount and one final amount, and if thats your situation, then they work wonderfully. But how can you calculate annualized returns if you put in money to invest in an account more than once, or if you make withdrawals more than once over a period of time? (This was actually exactly the situation I faced when I calculated my stock portfolio performance recently.)
The answer is actually pretty simple if you use Excel. Theres a built-in function called XIRR() thats easy to use if you format your data correctly. XIRR() uses Newmans method (an iterative process) to calculate your returns, so its not a method thats easily done by hand.
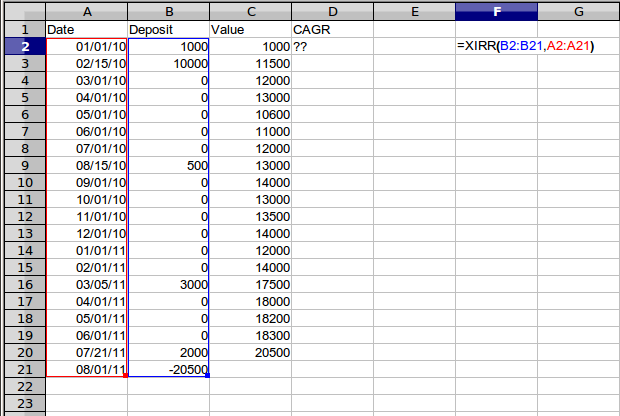
To find your return, simply list the dates of your deposits and withdrawals in one column. In the next column, list your deposit amounts as positive numbers and your withdrawals (or the current value of the funds youd be able to withdraw, if youre interested in that instead) as negative numbers.
For example, lets suppose you diligently put in a deposit into your 401(k) account on the first weekday of each month. (Maybe you try to deposit in $100 each month and deposit more in January after getting your bonus, but lets say you also deposit less in one month due to extenuating circumstances.) Then suppose that today, October 18th, you look up how much your 401(k) is worth and see a balance of $1,247 in your account. If you just looked at the total amount youve invested so far ($1,100) and your current value of $1,247, youd get a return of 13.36%. But remember, some of your money has been invested for a longer time than others, so this amount is really an underestimation.

Instead, suppose you want to find the annualized percentage return youve gotten so far taking time into account. To use XIRR, this is how youd enter in your data:
Note: If youd like to work through the examples yourself, heres the raw data you can copy into an Excel worksheet. First, open up a blank excel worksheet. Next, highlight the table below. Copy it, and then go back to your excel worksheet. Go to cell A1 (or another empty cell, if you want to put the data elsewhere), and then select Edit from the menu bar. Select Paste Special and then Text from the popup box. Click OK. The data should appear in your Excel worksheet just as it does above.


