How Can You Create a Personalized Portfolio Performance Benchmark
Post on: 15 Июнь, 2015 No Comment

You’re investing money towards your long-term financial goals: early retirement, paying for your children’s college, buying a second home.
But you may be wondering how to measure your portfolio’s performance.
You may hear the term “performance benchmark” tossed around on the financial news shows and you wonder, what exactly does that mean? Good question!
Let’s take a look at how to establish an intelligent portfolio performance benchmark, so that you can evaluate whether or not you’re on-track to achieving your goals.
What’s in a Portfolio Performance Benchmark?
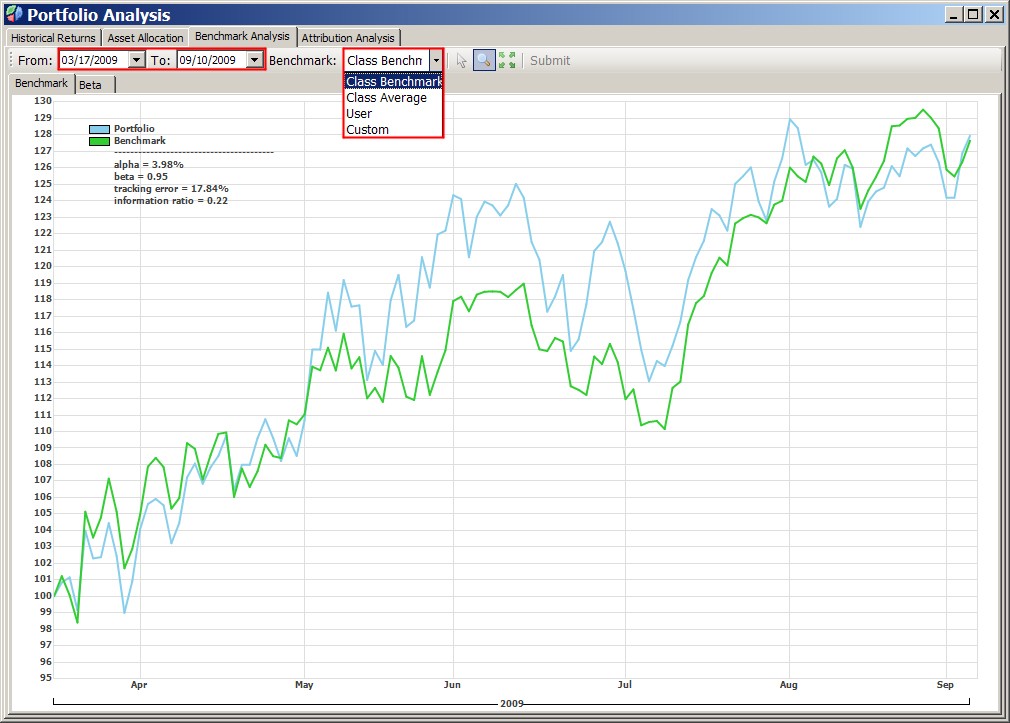
A benchmark should be a consistent metric that relates to the mix of assets in which you invest.
Let’s take a simple example. Let’s say you hold a portfolio of five large-cap U.S. equity mutual funds. It would be reasonable to benchmark the performance of this portfolio against the S&P 500, which is a widely-known, transparent and liquid gauge of U.S. large-cap companies. Every quarter or every year, you compare the performance of your portfolio to the performance of the overall S&P 500.
If you’re on-track with your underlying benchmark, you know that you’re performing as expected. But if you’re varying wildly from your benchmark, you might need to scrutinize your portfolio a little more deeply to discover why.
Benchmarks for Diversified Portfolios
What if your portfolio contains several types of assets? A diversified portfolio for a long-term goal like retirement may include U.S. large-cap, mid-cap and small-cap stocks, international stocks in both developed markets (like Europe) and emerging markets (like Brazil and China), short-term and intermediate-term bonds, and maybe some alternative assets like REITs and commodities.
How can you use a benchmark to see how this entire basket of assets is performing?
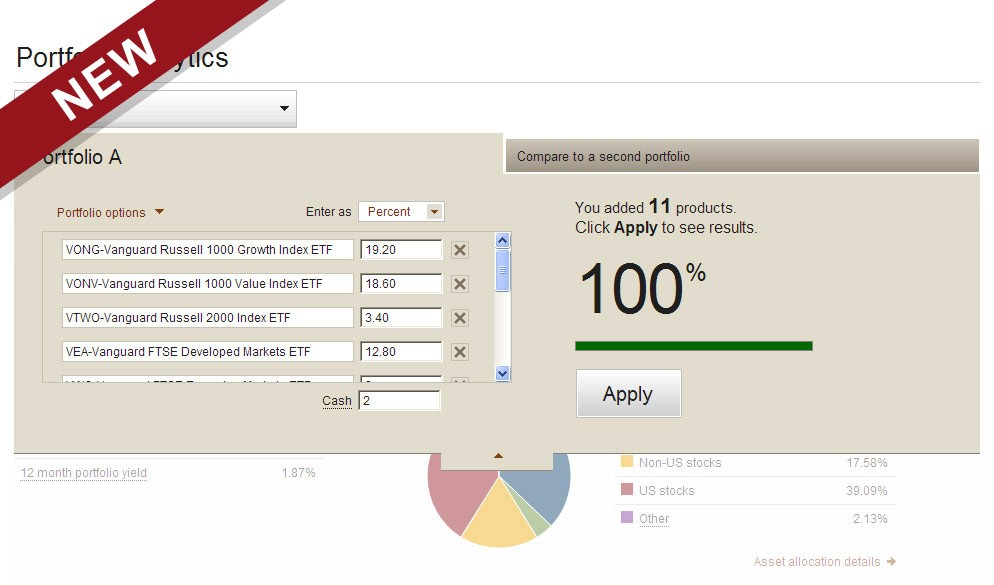
To faithfully measure the performance of this portfolio, we need to construct a “blend” – which is essentially a proxy for the key invested asset classes within your portfolio. This blended benchmark will feature some reasonable proportion to your portfolio’s allocation weight.
In other words, if your portfolio is 50 percent domestic equities, 20 percent international equities, and 30 percent bond funds, you should construct a “blended benchmark” that reflects those same proportions. Then you can measure your portfolio’s performance relative to your personalized benchmark.
Simple versus Complex Benchmark Performance Blends
You don’t need to have every single asset class in your portfolio represented in the blend. For many investors, a simple benchmark will suffice. This simple benchmark will be split along the proportions of high risk and low risk assets in your allocation weight.
Let’s say, for example, that you have about 70% of your portfolio in higher-risk assets like stocks or commodities, while 30% of your assets are in safer instruments like bonds.
You can set up a simple benchmark consisting of the S&P 500 as a broad proxy for the higher risk assets, and the Barclays U.S. Aggregate Bond index. a popular measure of fixed income performance, as a broad proxy for your lower-risk assets.
But what if you want to create a more complex blend?
You can dig deeper into the underlying components of your portfolio, and pick indices that represent each asset class. Instead of using the S&P 500 to measure all the equities in your portfolio, for example, you can use the Dow Jones Industrial Index to measure your large-cap stocks and the Russell 2000 as a benchmark to measure your small-cap performance.
Total Returns vs. Price
Once you choose the benchmarks that will represent your portfolio, you’ll need to gather information about the returns of each of these indices.
You can find the returns for most major market indices online. Look for something like this handy returns calculator for the Russell equity-style indexes.

When you measure portfolio performance, you want to focus on the “total return index” as opposed to a price index.
What’s the difference? “Total return” measures both capital appreciation and any income that comes from the asset, such as dividends or interest payments. Appreciation plus income are the two sources of your portfolio returns.
The price index, by contrast, focuses solely on price increases or decreases.
Constructing Your Portfolio Performance Benchmark Blend
Next, you’ll want to construct the benchmark blend. Don’t worry – this is pretty simple math.
Let’s say you want to set up a blend for a 70/30 split between the S&P 500 and the Barclays bond index. Let’s also assume that the S&P 500 returned 20% during the last 12 months, compared to 5% for the Barclays index. (These are hypothetical figures for illustrative purposes only).
The weighted average calculation would be (20% x 0.7) + (5% x 0.3). The first half of that equation represents the S&P 500, while the second portion represents the Barclays index.
Your “benchmark blend” – in this example works out to 15.5%, and that’s the number to compare to your portfolio performance.
One final piece of advice: don’t get hung up on benchmarks for relatively short periods of time. In any given period, things happen that can cause your portfolio performance to deviate somewhat from the benchmark.
The most important thing is to keep your asset allocation in line, and make sure your portfolio is balanced around your ideal allocation weights. Those weights should change only incrementally over the course of your investment horizon.
Do you use a portfolio performance benchmark? Tell us what you think.
For expert, unbiased advice on how to invest your retirement savings and a simple way to manage all your accounts in one place, visit Jemstep.com and sign up for a FREE Portfolio Manager account.


