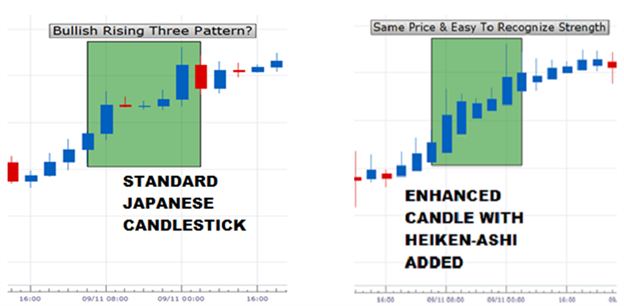
Heiken Ashi is the Japanese way of trading Forex markets
Post on: 16 Март, 2015 No Comment

By Kobe J Brown
On July 18, 2012
In both the local and global markets, traders use a variety of figures and calculations to decide how to invest for themselves and their clients. Often these numbers are put into charts and graphs so that trends are easier to analyze. One type of chart popular in the securities, commodities and equity markets is the candlestick chart. It combines the line graph and bar graph and ends up with a graph dotted by what look like candles with wicks (hence the name).
One particular type of candlestick charts that use weighted formulas to come up with more specific predictions for pricing in the market are called Heiken Ashi charts. Created in Japan by rice traders (Heiken Ashi means “average bar” in Japanese), these charts use calculations based on previous time periods or candles, combined with the numbers from the time period being analyzed to show how the changes can be used to predict future pricing behavior. The use of averages tempers the fluctuations that happen on an hourly or daily basis and shows a more accurate image of the price trend so investors can make the decisions accordingly.

Heiken Ashi are thought to smooth out the edges of the candlestick charts by using a series of averages and then recharting the numbers. The four main numbers charted are the open price (average of the previous day or candle’s open and close), the high (the greatest of the high, open and close of the current time period), the low (the lowest of the low, open and close of the current interval) and the close (the average of the open, close, high and low). These numbers determine the shading, shadowing, shape and length of the bar and the wick. Just by looking at the resultant shape, a trader can tell whether it’s wise to sell or buy; wait it out; or with how much risk they are acting.
A white candle no shadows means the market is bullish and it is safe to buy into that particular price point or keep what investments are already there. Slight shading at the top of a white candle means that a long term investment is safe, but a shorter one might not be purchased. A dark candle indicates a downward trend in the price means the value of the commodity is also going down and it is not wise to buy. It also means if they have long term investments in that commodity, they might want to sell before the trend heads too far down. A candle with shading in the both upper and lower areas indicates change is coming. That means the trader makes a decision to buy with risk that the change goes down or risks not buying and the trend heads upward, a missed opportunity.
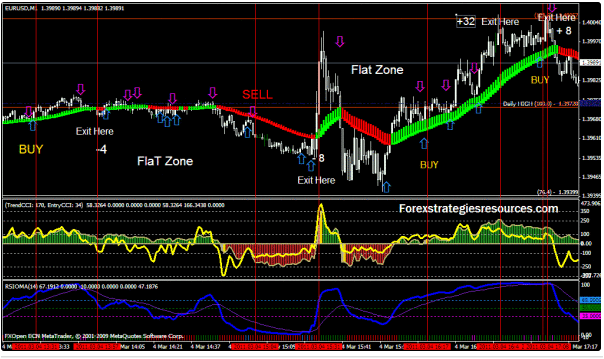
The Heiken Ashi charting system gives a specific view of the past and present as well as indicators for future pricing behavior in certain markets. The average calculations take away short term fluctuations. The predictions are more accurate than many other types of charts or graphs and are used globally by traders to make the best decisions for their own and their clients’ investments.


