Growth Versus Value and Interest Rates CXO Advisory
Post on: 11 Август, 2015 No Comment

In his 2007 book The Little Book That Makes You Rich: A Proven Market-Beating Formula for Growth Investing . expert Louis Navellier hypothesizes that growth (value) stocks tend to do relatively better when interest rates are rising (falling). Growth stocks benefit from the economic expansions associated with rising rates. Value stocks benefit from refinancing opportunities as interest rates fall. To test this hypothesis, we compare the performances of paired growth and value indexes/funds as interest rates, proxied by the 10-year Treasury Note (T-note) yield, vary. Using monthly and quarterly adjusted (for dividends) return data for a pair of growth-value indexes and a pair of growth-value mutual funds, along with contemporaneous T-note yield data, we find that:
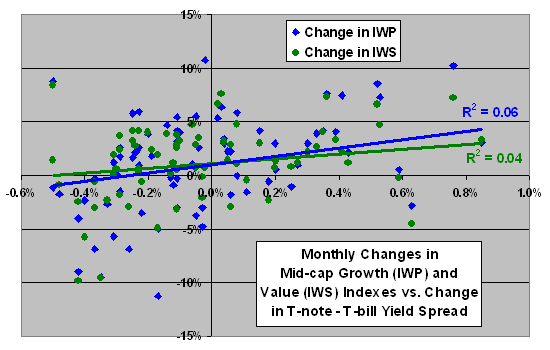
The following scatter plot relates monthly changes in both the iShares Russell Midcap Growth Index (IWP ) and the iShares Russell Midcap Value Index (IWS ) to the monthly change in the T-note yield starting in September 2001 (74 months). Results indicate that both indexes tend to perform better (worse) as interest rates rise (fall). The Pearson correlations for the IWP and IWS series are 0.36 and 0.34, respectively. The R-squared statistics for these series are 0.18 and 0.17, suggesting some explanatory power for interest rates in both cases.
The slope of the best-fit line for IWP (growth) is steeper than that for IWS (value), hinting that growth stocks may be more sensitive to interest rates than value stocks. The relative positions of the best-fit lines provide some support for Louis Navelliers hypothesis, with growth (value) stock returns higher when interest rates are strongly rising (falling). However, for most of the distribution, the difference in returns between growth and value is very small.
Note that IWS (value) offers positive returns over a broader range of interest rate changes than does IWP (growth). The return for IWP (IWS) over the entire sample period, based on dividend-adjusted prices, is 79% (119%).
Excluding September 2001 as an outlier makes no differences in relative results.
Might the differences between growth and value stock reactions to interest rates be more apparent on a quarterly basis?
The next scatter plot relates quarterly changes in IWP and IWS to the quarterly change in the T-note yield starting in September 2001 (24 quarters). Results indicate that both indexes tend to perform better (worse) as interest rates rise (fall). The Pearson correlations for the IWP and IWS series are both 0.46. The R-squared statistics for these series are both 0.21, again suggesting some explanatory power for interest rates.
The slope of the best-fit line for IWP (growth) remains steeper than that for IWS (value), and the relative positions of the best-fit lines again offer some support for Louis Navelliers hypothesis, with growth (value) stock returns higher when interest rates are strongly rising (falling). However, for most of the quarters in the sample, the difference in returns between growth and value is small and appear to favor value overall.
The time period considered so far probably constitutes less than one full contraction-expansion economic cycle and may be unrepresentatively influenced by the unusually severe 2000-2002 bear market. Might a longer time series reveal more definitive differences in the reactions of growth and value stocks to changes in interest rates?
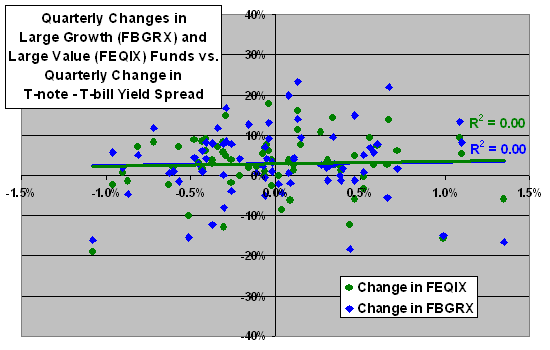
The final scatter plot relates quarterly changes in both the Fidelity Blue Chip Growth (FBGRX ) and the Fidelity Equity-Income (FEQIX ) mutual funds to the quarterly change in the T-note yield starting in September 1989 (72 quarters). Results offer weak indications that both funds tend to perform better (worse) as interest rates rise (fall). The Pearson correlations for the FBGRX and FEQIX series are 0.18 and 0.22, respectively. The R-squared statistics for these series are 0.03 and 0.05, suggesting little explanatory power for interest rates over this longer sample period. Results also indicate that the growth and value funds have about the same sensitivities to changes in interest rates (same slopes for best-fit lines).

The lack of differences between growth and value for this longer sample period provide no support for the hypothesis.
In summary, limited analyses offer little support for Louis Navelliers hypothesis that growth (value) stocks systematically outperform when interest rates are rising (falling).
Note that the variables chosen to represent interest rates, growth stock returns and value stock returns may not be optimum for testing the hypothesis. Portfolios more extremely tilted toward growth and value might provide stronger support for it. Use of inflation-adjusted interest rates might also affect the conclusion. Also, the samples may not be long enough to capture a difference in economic-cycle effects on growth and value stocks.
In any case, it is not obvious that accurate interest rate forecasts are possible.
Why not subscribe to our premium content?
It costs less than a single trading commission. Learn more here.


