ETF Market Growth Opportunity and Risk
Post on: 16 Март, 2015 No Comment

by John Lounsbury
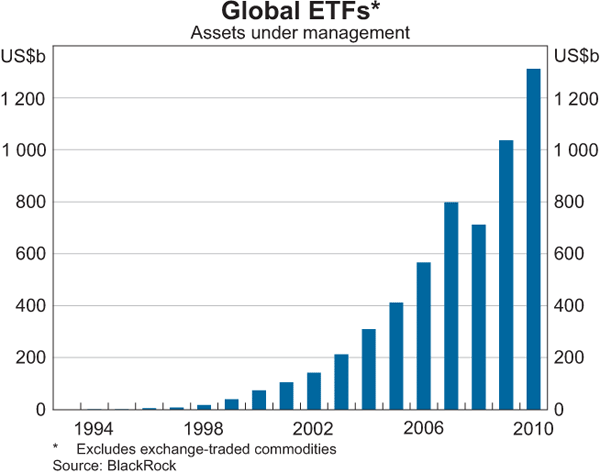
ETF (Exchange Traded Funds) offerings have become very popular over the past decade, with a total market value now exceeding $1 trillion. According to ETF Guide the first ETF, the S&P Depository Receipts Trust Series 1 (NTSE:SPY), was launched on the Amex Exchange in 1993. Although this was the first still surviving ETF in the U.S. S&P 500 Index Participation Shares traded briefly on the AMEX and Philadelphia exchanges in 1989 before the CME (Chicago Mercantile Exchange) obtained a court order to close them. About.com says the first ETF was created in Canada in 1989, the Toronto Index Participation Fund (TIP 35), which started trading in 1990 on the TSX (Toronto Stock Exchange). Other key milestones for ETFs include the commencement of ETF trading in Europe (1999).
Follow up:
The numbers of ETFs have grown steadily since 1993, accelerating in the last few years, especially after the opening of actively managed ETFs in the U.S. (2008). According to Jack Willoughby in Barrons on July 16, 1,293 new ETFs and related products have come to market over the past two years, bringing the global total to 3,987.
Editors note: A number of different organizational structures that constitute the various different forms of ETFs and related products, such as ETNs, are summarized by the ETF Guide and Wikipedia .
Willoughby says the total assets in ETFs and related products has now reached $1.6 trillion. This is considerably more than the total assets reported in a white paper from Bank of New York Mellon and Strategic Insight with a June date, which contains the following graph:
Part of the difference may be the reference date, the BNY Mellon number being as of March 31, 2011. The product list the two sources used may also be different, with Barrons casting a wider exchange traded product net.
Recently, synthetic ETFs have come into question regarding unexpected risk exposure for investors. From Barron s:
The most comprehensive review came in April when the Financial Stability Board, which monitors systemic risk and coordinates international regulatory changes, complained of a growing opacity and complexity in so-called synthetic ETFs, produced mostly in Europe. Synthetics are roughly similar to exchange-traded notes, or ETNs, in the U.S. In these vehicles, sponsors like banks and fund outfits distribute shares for cash and then invest the cash in baskets of collateral, which then get swapped by the derivatives desks of the sponsors for returns that track specific indexes. There are no controls over what goes into the collateral baskets, which has raised questions about valuations and other issues to the FSB and other regulators. Similar sorts of risks can reside in ETNs, which are essentially bonds that promise investor performances equal to certain benchmarks. The benchmarks can range from currency returns to commodity and hedge fund indexes.
The FSB frets that some instruments could leave investors exposed to risks they have not anticipated.
It is also reasonable to question whether a financial systemic risk could build within the synthetic ETF structures that might cause the type of implosion that occurred in 2008 when the Lehman failure brought down the financial world because of the web of derivatives that tied financial firms together. The assets in ETFs are probably insufficient to present a serious threat now, but what will happen when this investment group grows much larger? The following graph shows the estimated growth potential in the near term:
Future growth is expected to be significant in the non-traditional ETF/ETN areas. From BNY Mellon:
While core strategy ETFs will likely continue to dominate net inflows to the industry in the near future, we expect satellite-type ETFs, which comprise the bulk of innovative ETFs 2.0, to increase in market share. Satellite-strategy ETFs accounted for an estimated 30% of U.S. ETF assets as of March 31, 2011, according to Strategic Insights Simfnd database, up from 18% at the end of 2008. Commodity, leveraged and inverse, and hedge-fund-like ETFs are among the nontraditional ETF types that should see growth between now 2016.and
The growth trajectory of active ETFs is too difficult to predict, especially as many active equity ETFs will need to establish one- to three-year track records to gain credibility. But this segment should see some consistent growth over the next five years.
For reference, the past and current distribution of ETF types is shown in the following graph:
Also for reference, the following table shows the top ten ETF managers. This table is part of a larger table of the top 20 in the BNY Mellon paper.
ETFs vs. Mutual Funds
The advantages of ETFs with respect to mutual funds include lower costs, continuous trading throughout the day, the same conditional trade orders as for stocks and better tax accounting control opportunities for investors. The details of theses comparisons have been widely discussed and will not be repeated here.  See Elliott Morss’ related article at the end of this one, for one good discussion.

The area that will be addressed is the capitalization of ETFs compared to the other major areas in the market. The first thing that is noticed is that ETFs are still very small compared to the total of the securities markets and also compared to mutual funds. The total assets of ETFs is in the range of $1 to $2 trillion, while reference numbers for the total in global securities markets are over $130 trillion.
Nation Master gives a valuation for global stocks of $49.0 trillion ($21.5 trillion U.S.) in 2005 while Wikipedia gives the 2009 total global bond market value as $84.2 trillion ($31.2 trillion to $34.2 trillion U.S.). Using these numbers, ETFs constitute 1% or less of the global securities markets.
Mutual Funds, on the other hand, are much more significant players, with assets that are around 18% +/- of global securities capitalization. The following graph from ICI Fact Book shows the numbers:
Even U.S. money market mutual funds assets dwarf global ETF capitalization, even though yields are essentially zero. From this weeks Business Week .
Total U.S. money market mutual fund assets rose $9.69 billion to $2.696 trillion for the week that ended Wednesday, the Investment Company Institute said Thursday.
Assets of the nation’s retail money market mutual funds fell by $5.12 billion to $915.43 billion, while assets of institutional money market funds rose $14.80 billion to $1.781 trillion, the Washington-based mutual fund trade group said Thursday.
Assets of taxable money market funds in the retail category fell $3.33 billion to $718.81 billion. Tax-exempt fund assets fell $1.79 billion to $196.62 billion. Among institutional funds, taxable money market fund assets rose $17.2 billion to $1.675 trillion; assets of tax-exempt funds fell $2.4 billion to $106.22 billion .
However, ETFs have been attracting investment dollars rapidly while mutual funds have been bleeding, as shown in the following ICI Fact Book graph:
It seems obvious that ETFs have a lot of growth in front of them, while mutual funds may not. Nonetheless, mutual funds look to be able to remain king of the investment company hill for many years to come. It would also seem obvious that ETFs should eventually replace mutual funds as top asset gatherers, unless, of course, the derivative risk exposure blows up.


