DALBAR Study Overstates Investors Bad Timing
Post on: 17 Апрель, 2015 No Comment

by Harry Sit on March 14, 2011 17 Comments
We just passed the two-year anniversary of a recent stock market bottom. Numerous articles in the newspaper and on the web show investors as a whole are dumb. They took money out of the stock market near the bottom and they are now putting money into the stock market after the market recovered almost to its previous peak.
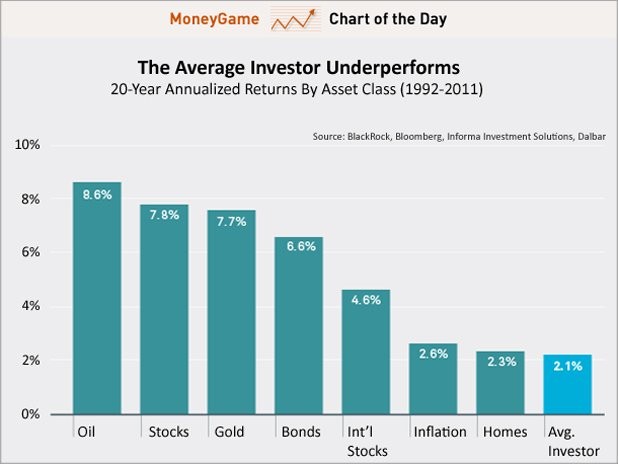
No doubt such behavior exists. How bad does it hurt the investors return when they buy high and sell low? The most widely cited study is probably DALBARs Quantitative Analysis of Investor Behavior. This study compares the investors returns against market returns. Mutual fund tracking company Morningstar also calculates investor returns for every fund and compares them against the fund returns.
Investor return is a dollar-weighted return (or more generically money-weighted return). It takes into account the size and timing of investors purchases and sales. If investors put a lot of money into a fund and the fund does poorly after that (buy high), the investor return will be low relative to the funds published return. Same if investors pull a lot of money out of a fund and the fund does well afterwards (sell low).
The latest DALBAR study shows the investor return in all equity funds in the 20 years ended in 2009 was 3.17% while the S&P 500 returned 8.20% during the same period. It doesnt say it directly but it implies that investors poor market timing cost them 5% a year for 20 years.
Ive seen this interpretation in many books, including books by respected authors Burton Malkiel, Larry Swedroe and Rick Ferri. While the intention is good warn investors against buying high and selling low the interpretation is wrong because comparing investor returns against index returns is comparing apples to oranges. The 5% a year number is so incredible that makes it not credible. The so called behavior gap isnt as high as the DALBAR study implies.
Buy high sell low will make investor returns lower than market returns but its not the only factor. The pattern of market returns over time also plays a big role. When you see the investor return is lower than the market return, you cant attribute the difference all to buy high sell low.
Lets look at two hypothetical examples.
Suppose the stock market doubled in year one and then stayed flat for nine years. Over the 10-year period, the market return is 7.2% a year (rule of 72). If an investor invests $1,000 every year in an index fund that exactly matches the market, the investor will have $11,000 at the end of 10 years. Only the first $1,000 had a good return. The other $9,000 had zero return. As a result, the investors dollar-weighted return is only 1.7% a year for 10 years.

The big difference between the markets 7.2% per year return and the investors 1.7% per year dollar-weighted return isnt caused by any performance chasing or bad market timing. The investor is just faithfully investing in an index fund for the long term. When the market did well in year one, the investor simply didnt have much money invested to catch the good return.
Now suppose the stock market stayed flat for nine years and then doubled in year 10. Over the 10-year period, the market return is still 7.2% a year. If an investor invests $1,000 every year in an index fund that exactly matches the market, this investor will have $20,000 at the end of 10 years, resulting in a dollar-weighted return of 12.3% a year for 10 years. Its higher than the market return because in the year when the market return was high, the investor had $10,000 invested versus only $1,000 invested in the previous example.
Depending whether the market has higher returns in the beginning or in the end, investors are seen either as dumb or smart even when they make no effort to time the market.
Thats exactly what happened lately. Morningstar shows some mutual funds have investor returns much higher than the fund returns. Here are some examples:
3-Year Average


