Commodity Channel Index
Post on: 16 Март, 2015 No Comment

Commodity Channel Index
By Raul Canessa C.
Click to enlarge the image
Commodity Channel Index – A Effective Tool for Traders
The Commodity Channel Index (CCI) was published in the October 1980 by Donald Lambert. Since its introduction its popularity is rising higher and higher as it is becoming a very common tool for traders. Commodity channel index is becoming a very effective tool for traders that use to identify cyclical trends in commodities as well as equities and currencies. There is nothing handier tool than the commodity channel index as it is a very easy way to chart cyclical turns in commodity prices. There are so many traders implied this tool in their business and get huge success in the field of trading. There is certain formula available to calculate commodity channel index.
The formula has been given below:
CCI =(Typical Price – SMATP) /(.015 X Mean Deviation)
Fortunately, you don’t have to calculate the CCI formula by hand, unless you have to give a good test of your mathematic skills or knowledge. CCI is an oscillating indicator and momentum indicator. The CCI is been calculated by using the typical price and simple moving average. The standard deviation is after that added with the scaling factor of .015 and scaling factor approximately confines 70% 80% of indicators fluctuations around +100 to -100. Scaling factor of 0.15 was been suggested by Lambert Donald.
The formula makes use of simple moving averages of typical price that is same to the average price. The unweighted variables make the consistent evaluation of the actual conditions with relation to the historical price activity. CCI is been used to trade currencies, equities, as well as commodities. All the chartable assets are analyzed with the indicator. The CCI oscillates above & below zero line.
Uses of the CCI
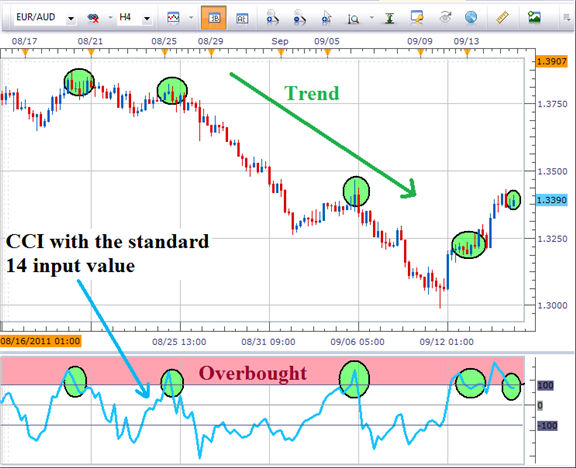
-CCI as an oscillator Like most oscillators, CCI helps us to identify points of overbought and oversold. When the CCI reaches values above +100 (over-bought) and below -100 (over-sold) and returns to neutral territory (between +100 and 100) it gives a signal to buy or sell. In this case we used a 50-period CCI CCI (50). We must remember that overbought and oversold conditions have better results when we only signals in the direction of the trend. For example, we use an EMA to identify the trend, and if the trend is just taking the conditions of oversold (buy signal) and vice versa. Also remember that the oscillator signal when the indicator we get back to neutral territory (from -100 to +100 in the CCI).
-CCI at extreme levels This is the main signal CCI (according to its creator Lambert). As we explain, CCI(30) or 30 periods CCI is kept to 80% of time on neutral territory (+ / 100). Breaks out of these levels indicate a strong movement.
-CCI to trade divergences It occurs when the price reaches extreme values and the indicator fails to do so or when the indicator reaches extreme values and the price fails to do so. The differences indicate that although the trend is still intact, is not as strong as it was earlier, indicating a possible change of trend in the short term.
-Trading the breakings of CCI`s trendlines As the classic price trend breaks, CCI also creates ceilings (resistences )and floors (supports). When two or more roofs or floors are formed they can be connected to form a trend line, if the indicator breaks these trendlines, there is a trading signal in the direction of the breakup.


