ClosedEnd Funds_1
Post on: 24 Апрель, 2015 No Comment

NATURE. a closed-end fund (CEF here) is a fully-SEC-regulated management investment company very much like a mutual fund. Incidentally, the media sometimes incorrectly uses the phrase “closed-end MUTUAL fund” which is an internal contradiction since a mutual fund is an OPEN-end fund! CEFs should not be confused with mutual funds that have been closed to new investors or to new money, as the well-known Fidelity Magellan Fund was for many years until early 2008.
Also contrary to the common but inaccurate media definition, here is the correct definition of a CEF “a CEF is a regulated investment company which does not stand ready to redeem its shares every day the NYSE is open.” (The quick but inaccurate media version says that a CEF is listed on a stock exchange and has a fixed number of shares.)
POPULATION SIZE. As this article was written in Q1/2008, there were about 680 CEFs in the USA. (A larger number exist in the UK and roughly 100 in Canada.) CEFs existed in the USA before the first mutual fund! Common shareholder assets in USA-registered CEFs totaled about $335 billion at the end of 2007.
DIFFERENCES vs. MUTUAL FUNDS. CEF portfolios are managed very much as are those of mutual funds. The CEF has a portfolio manager who adheres to the fund’s publicly stated investment objective. There is, as with a mutual fund, a board of directors/trustees who look after shareholder interests and act as a check on the management company. For more than 90% of CEFs, the principal difference vs. a mutual fund is that a CEF lists its shares for trading on a stock exchange or NASDAQ. (The remainder of CEFs offer to redeem their shares periodically, typically quarterly, via “tender offers.”) Nearly all CEFS issue quarterly reports, whereas most mutual funds report only each six months. CEFs do not burden holders with the costs of 12(b)-1 fees for marketing, as many mutual funds do.
Because they do not need to worry about holders’ asking to be cashed out as a mutual fund does, portfolio managers in CEFs can be 100% invested if they choose, rather than typically keeping about 4-5% in cash for redemptions. They also tend to display moderately lower annual turnover ratios than do mutual funds. Since nearly all CEFs trade as stocks, they cannot impose minimum holding periods or penalties for quick redemption, as many mutual fund families now do. Their shares trade freely, just as shares of GE or McDonald’s do.
INITIAL PUBLIC OFFERINGS (IPOs) of CEFs. The large majority of CEFs “go public” in a single public offering event just like a corporation does. After that, nearly all trade on a stock exchange. CEFs trade as stocks with ticker symbols, so an investor can use all kinds of orders like limits, stops, market, etc. When a CEF conducts an IPO through brokers, its offering price includes a “load” typically in the range of 3% to 6% and therefore the NAV is immediately less than buyers have paid. Historically, shortly after the IPO a large majority of CEFs tend to trade at discounts rather than premiums to their ongoing NAVs. This leads to common published advice that investors might wait until after the IPO and hope to buy a CEF at a discount rather than an a premium to its true value.
SOURCES of INFO on CEFs. Many newspapers have in recent years eliminated or reduced printing lists of daily quotations on stocks and CEFs. The Wall Street Journal. typically in Section C, does still provide daily NAV and market data in print. Likewise both Barron’s and The NY Times on weekends. Investors’ Business Daily shows on Tuesdays a short list of CEFs, mainly only the equity funds. Two excellent and free sources of quotations as well as portfolio and dividend information are: CEFA.com (the official site of the Closed-End Fund Association) and ETFconnect.com (which also carries parallel data on ETFs). The latter site provides handy life-of-fund history of distributions as well as tables and graphs of premiums and discounts at which the funds’ shares have traded. The former site includes some news items/press releases on CEFs.
In recent years a number of CEFs families have created websites on which they display news and information including portfolio holdings of their funds. Such sites are less common among the CEF families closely associated with brokerage firms. An investor can readily find out if a CEF has a website by looking at press releases by the fund, found on major free Internet charting services. At the end there is an investor contact e’mail or phone, and a website address if one exists.
The website QuantumOnline.com (free, but they ask users to register) provides a handy list of IPOs in ETFs, and in many cases the SEC prospectus is a click away. This IPO listing is under their tab “Special Lists.”
CEFs represent a small corner (about 3%) of the funds universe, so not much is written about them since publishers fear not selling enough books to cover costs. The best (and most recent) book on CEFs is Investing in Closed-End Funds: Finding and Building Wealth . by Fredman and Scott. An excellent chapter on CEFs appears in How Mutual Funds Work by Fredman and Wiles.
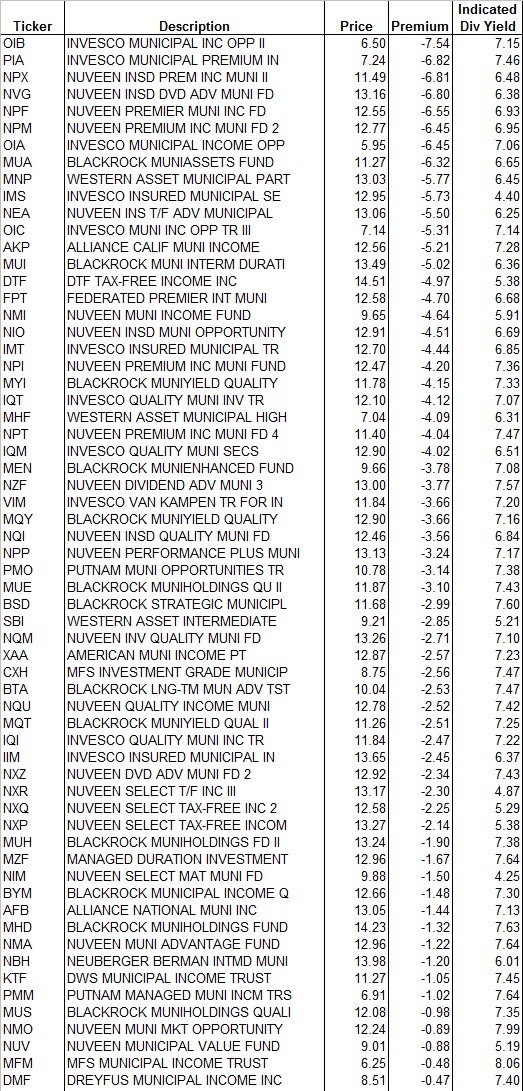
PRICING OF CEFs. Because the large majority of CEFs trade on stock exchanges (and have ticker symbols), their prices are determined like those for any other stock: by supply and demand. For this reason, the shares of a CEF may trade at above their underlying net asset value (NAV) or below it. Trading above is called trading at a premium; below is at a discount. As compared with a mutual fund, which always redeems its shares at NAV (before any penalties or fees), this adds another layer of uncertainty: market direction, portfolio manager success, AND premium/discount uncertainty. Depending on how an investor looks at it, this can be a risk or an opportunity. Contrarian and value investors like buying CEFs in out-of-favor investment themes at discounts and hoping to sell than later when styles move in their favor.
LIQUIDITY of CEFs’ SHARES: The average CEF has about $500 million in outstanding shares for the public to trade. The median, however, is closer to $200 million. Either way, these typical sizes would be classified as a microcap stock, so liquidity is often thin (few institutions ever trade in CEFs). Therefore it is advisable to use limit orders when placing buy or sell trades. Online chart services and brokerage websites display spreads and best-price order sizes, which is useful information to the trader or investor in CEFs.

CEFs vs. ETFs. Both trade on stock exchanges (in nearly all cases for CEFs). ETFs are passively managed index-based portfolios, whereas CEFs have active management. Because of that difference, ETFs offer lower expense ratios than prevail for either CEFs or mutual funds with similar investment objectives. The technical structure of ETFs creates arbitrage opportunities between market prices and NAVs for institutions, which means that ETFs very seldom trade at more than about 0.5% more or less than their current NAVs. As the tables in print media and on websites show, premiums or discounts can fairly commonly run to 10% or more in CEFs. Most brokers and advisors suggest that clients never buy or hold a CEF when its premium exceeds about 5%. You could buy a comparable mutual fund even with a load for that or less! Exceptions include extremely talented CEF portfolio managers or asset classes where no comparable ETF or mutual fund exists.
USE OF LEVERAGE BY CEFs. Roughly 80% of CEFs are income oriented, and about 70% of CEFs are leveraged. This means that they borrow money and use those extra dollars to invest in their designated asset class. The hope, of course, is that the money borrowed will come at lower cost than the earnings (income and capital gains/losses) on the amount invested. Leverage is used as a technique to increase income – and therefore the distribution rate – to shareholders in the CEF. When the yield curve is steeply sloped, this approach is usually successful. Funds using leverage almost never remove it.
The major risk in leverage, especially in income-oriented funds, is that the owner is effectively carrying bonds, preferred stocks, or REIT or utility shares (through the fund) on margin. So when rates go up and bond or other income securities’ prices go down, the NAV of the fund declines faster than if leverage were not in use. The ETFconnect.com website is a quick source to see if a CEF uses leverage: scroll down and look at the capitalization at the lower left. A prospectus or annual report will also disclose this, but may not be as handy. On the CEFA.com website, an investor can screen funds on the criterion of leverage use/non-use (and on other criteria such as discounts or returns).
WHY CEFs EXIST. CEFs can offer investors access to high-reputation portfolio managers, or can invest in illiquid asset classes not suitable for mutual funds. Examples of the latter include small-country markets, pre-public securities, micro-cap stocks, municipal bonds, and some special strategies like option writing. The key issue is that CEFs can hold securities that mutual funds might not, because the CEF does not face possible redemptions that might force it to sell portfolio holdings. CEFs can also use leverage (good at some times but not others), while mutual funds almost never borrow.
From the viewpoint of the management company, a CEF represents “permanent” assets under management, again because there are no redemptions in most CEFs. From the brokerage industry’s viewpoint, a CEF is a packaged product that earns a significant up-front commission and which the sales force can tell clients requires an urgent decision at IPO time (whereas a client can postpone buying a mutual fund until anytime he/she chooses). History shows that most CEFs come to market in clusters by type, when a given asset class is hot rather than out of favor.
A CAUTION ABOUT HIGH YIELDS IN CEFs. Yield is not free of risk. Well over 100 CEFs implement “managed-distribution” or constant-distribution plans, typically providing cash flow of about 8-11% of NAV annually. If a fund does not earn what it pays out, the difference comes in the form of return of capital and reduces the fund’s NAV by an amount equal to the excess. For example, if a fund investing in bonds or REITs or writing calls on its underlying stocks is actually earning 6% after expenses and is paying out 9%, the NAV is being eroded by 3% a year. On a fund with a $20 NAV, this means that after one year there is only $19.40/share left on which to earn yield. Over the years this process becomes a snowball rolling downhill faster, as the payout exceeds the earnings by greater amounts. Investors should understand that the price they pay for a high cash yield will include some tax record-keeping complexity and a likely systematic slide in NAV and market price over time. That extra cash “yield” includes a gradual paying-back of your own capital! High yields on CEFs tend to cushion them against trading at major discounts, and this is the main reason for implementing these “managed-distribution” plans.


