Clarifying the Information Ratio and Sharpe Ratio
Post on: 16 Март, 2015 No Comment

Mukul Pareek
With the interest in hedge funds and other alternative investment mechanisms soaring, here is an attempt to provide an intuitive explanation for understanding and interpreting the Sharpe Ratio and the Information Ratio. They are both indicators of risk adjusted returns, and are ratios of mean returns to standard deviations of some flavor, but different from each other.
The Sharpe Ratio:
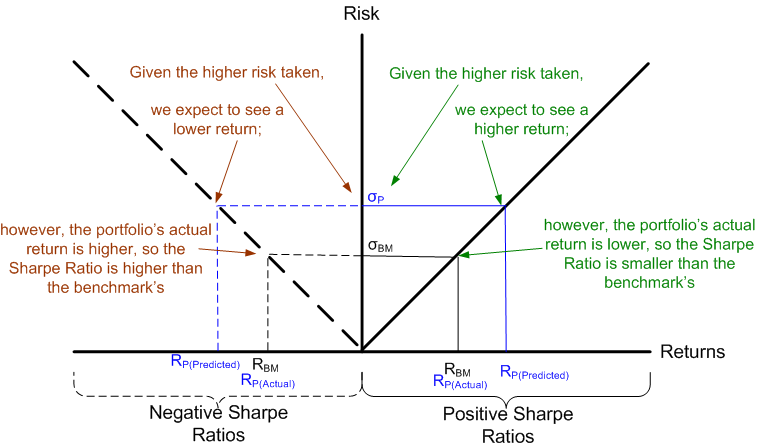
The Sharpe Ratio reflects the ratio of all excess returns over the risk free rate to the total risk (or standard deviation) of the return stream. In other words, we strip out the risk free rate from the earned returns, and divide that by the total standard deviation of the returns.
The Information Ratio:
The Information Ratio, on the other hand, is the ratio of the alpha component of total returns to the standard deviation of these excess alpha returns. The alpha component is the return that is attributable to the managers skill (or luck . and is the residual after taking out the risk free return and the beta components from the total returns. Also note the difference in the denominator while the Sharpe ratio considers the standard deviation of the total returns, the Information Ratio considers the variability of only the alpha component of the return (which also forms the numerator).
Conceptually, think of this like this: if total returns can be considered the sum of the risk free rate, the beta (i.e the compensation for taking on systematic risk, or market risk), and the alpha, then the Sharpe Ratio looks to express the excess returns over the risk free return (i.e, beta plus alpha) per unit of total risk undertaken. That is intuitive because the risk free rate, by definition, has no risk anyway and all risk arises from the beta and alpha components.
The Information Ratio only looks to compute the return per unit of risk undertaken for the alpha component. This is important because alpha is always in a very risky category its mean for the market as a whole is zero (in practice slightly less than zero because of transaction and other costs) and therefore it is easy to lose money on alpha that will bite into the beta returns.
Here is a graphic that explains the whole reasoning:

Interpreting the Information Rat, or, Why is the Information Ratio Important?
The Information Ratio is very useful to understand how risky is dabbling with the alpha in question. If we were to assume that alpha returns will be normally distributed, then the Information Ratio allows us to model the alpha as being a distribution with mean = IR and standard deviation = 1. This is intuitive because IR = (mean alpha return/standard deviation of alpha returns). A ratio of say, 0.4 can be interpreted to imply a normal distribution with mean equal to 0.4 and a standard deviation of one. From this point, everything is easy because we can now estimate the probability of losing money, or the probability of meeting a benchmark.
Note that just simply putting the formula =normsdist(-IR) gives us the probability of losing money in one year.
We can extend the analysis to multiple years for example, consider a manager with an alpha of say, 3%, and standard deviation of say 10% (IR = 0.3). The probability of him losing money over a one year period is 38%. Now think of a three year horizon. The mean returns over a three year period will be 9%, and the standard deviation will be (3^1/2)*10%, or 17.3%, and therefore a possibility of losing money over a three year period to be about 30%.


