Bollinger bands
Post on: 16 Март, 2015 No Comment

Bollinger Bands ® is a registered trademark of John Bollinger
Bollinger bands 101 Why Everyone should use Bollinger bands
Originally created by John Bollinger, Bollinger bands are a tool that allows investors to analyze volatility and relative price levels over any particular period of time. This indicator is comprised of three bands which will reflect any particular investment’s price action.
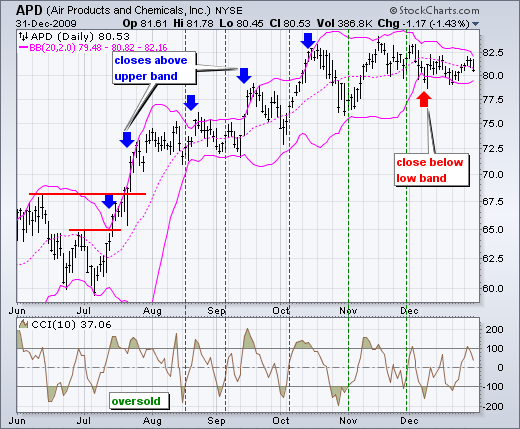
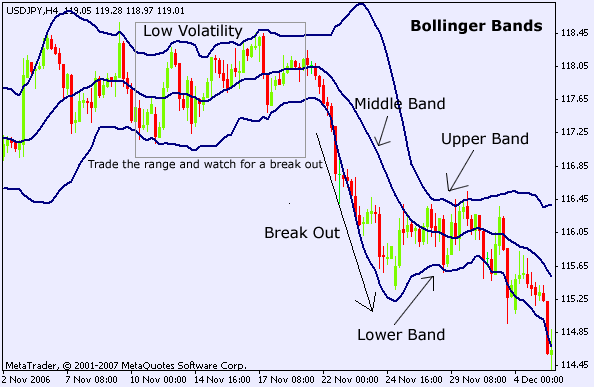
These bands consist of a moving average in the middle, with an upper and lower band of two standard deviations above or below the simple moving average. The standard deviation is a statistical measure that offers a good reflection of price volatility. Sharply changing prices will result in widening of the bands, while a lack of volatility will be reflected by their narrowing. Closing prices are normally used for computing Bollinger bands . The most common construction is based upon a 20 day simple moving average.
Bollinger bands The Appeal
The attractiveness of the use of Bollinger bands to any investor is in its ability to quantify relative price levels and volatility. When used in conjunction with price action movements and other indicators, this investment tool can generate signals that foreshadow significant moves allowing for profitable trading opportunities. When used in its most simplistic fashion, this indicator is considered an excellent signal to determine if the investment under consideration is oversold or overbought.
When prices touch the upper Bollinger limit, this signifies there is an opportunity to consider concerning the sale of the investment. Conversely, when prices reach the lower limit, the standard practice is to consider taking a long position.
Bollinger bands and Market Psychology
As these bands are so widely viewed in the marketplace, anyone considered trading activity should be aware of the significance when prices approach upper and lower band limits, as these are the most common entry and exit points for market participants. More often than not, one can visually confirm on a historical price chart that prices tend to reverse themselves when activity reaches the levels as represented by Bollinger bands. In addition, penetration of the bands and continued movement in the direction of penetration usually entails growing momentum for continued upward or downward movement.

When used in conjunction with other confirmation signals, the reaching and/or penetration of the limits represented by Bollinger calculations have shown themselves to be excellent opportunities for profitable results.
Bollinger bands Their Most Effective Use
The most recommended method of using Bollinger signals is to undertake positions after a period of time in which the bands have been relatively narrow. The longer such a time has existed, the greater the likelihood that a penetration will occur and continue in the direction of the breakout, especially if this event occurs in the direction of the previously established longer-term trend.
Another useful signal would be the occurrence of a relative top or bottom in prices outside the band, followed immediately by trading in the opposite direction within the established band limits. This is viewed in the marketplace as a good preliminary indicator that a reversal in price trend is about to occur. Bollinger bands, although not originally designed to be a primary trading signal technique, do offer opportunities for the astute investor to identify high profit probability entry and exit points for successful trading.
These types of results will only be enhanced when Bollinger bands are used in conjunction with other indicators. Regardless of the market, Bollinger bands are indispensable in developing trading strategies.


