Bollinger bands
Post on: 16 Март, 2015 No Comment

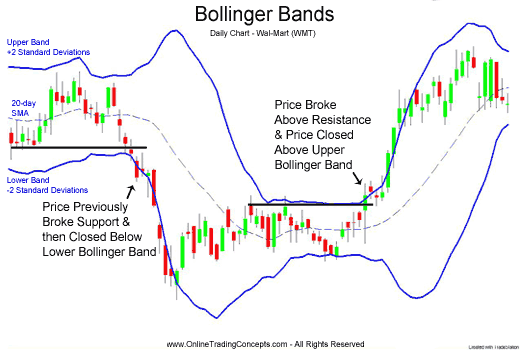
The classical Bollinger bands consist of a 20 periods moving average and an upper and lower line which represent deviation from the average. Deviation in this case is defined by a statistical measure called standard deviation (SD), which generally measures the distance from an average.
In probability theory when a group of observations are normally distributed, like supposedly stock prices, then 67% of all observations should fall within 1 standard deviation up or down from the average, 95% should fall within 2 standard deviations and 99,7% within 3 standard deviations. The upper and lower lines of classical Bollinger bands are 2 standard deviations up and down from the 20 periods moving average and that means that 95% of stock prices should be within this range. This is exactly the concept where Bollinger bands are based. In real world, financial products prices are not normally distributed so the basic concept of Bollinger bands is disputed.
As many other technical indicators, its use depends on the technical analyst/trader and it is subject to completely different and controversial interpretations. It cannot be used in isolation or mechanically, but only in combination with other technical or fundamental criteria. Also in some cases it is optimal to readjust the period of the moving average in order to better correspond to the particular price chart. We present below two different ways in which it is used by traders.
1. Opening of position on the lower or upper line
In combination with other technical criteria like support. resistance. candlestick patterns and others, it can be used as a selling signal when price touches or breaks the upper line and as a buy signal when it touches or breaks the lower line. In the daily chart of JPM below we open a long position at point 3 because price has visited a strong support in the context of a mildly up-trending market. Also at point 3 we have an inverse hammer candlestick pattern which fortifies the long signal and augments the possibilities of a reversal. At the same time price has broken the lower line of Bollinger bands so there is 95% chances according to normal distribution that the price will reverse upwards in order to be in the band.
Notice also that at resistance at point 2 we havent got a reliable entry point (although price retraced a little due to the strong resistance), because at that time the market was in a strong uptrend and in that case a break of the upper line isnt a good signal for selling or short selling. Thats why before entering a position it is always prudent to apply the trading algorithms in order to avoid, as much as you can, false trading signals.
2. Opening of position when price breaks violently the upper or lower line
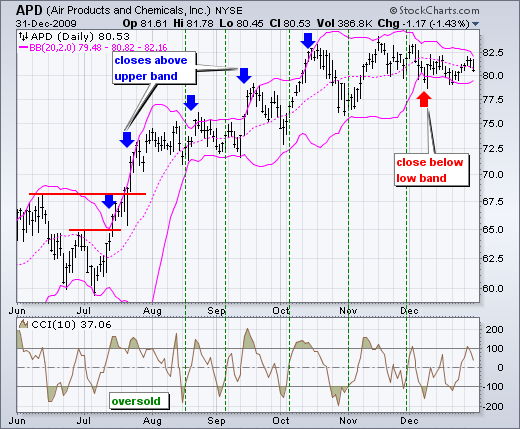
After a strong breakout or breakdown we enter in the same direction. This is a signal for the beginning of a new trend. Below there are two examples of this strategy that produce profitable trades.

At point 1 in the daily chart of RIMM (below) we have a very strong breakdown which signifies the beginning or continuation of a downtrend.
At point 1 in the daily chart of CRUS (below) we have a very strong breakout which signifies the beginning or continuation of an uptrend.
Some analysts use the moving average of the Bollinger bands as a retracement level for reentering long in an uptrend or short in a downtrend, but this method is quite unclear and too vague to be applied.
Conclusively, Bollinger bands are a supplementary secondary indicator, which is not at all a prerequisite in order to perform successful trades.


