Best way to measure mutual fund investment risk
Post on: 4 Апрель, 2015 No Comment

Search
Best way to measure mutual fund investment risk
Mutual funds work on two major premises. The first premise is diversification and the second is professional management. Both of them help fund houses reduce risk induced by investing in individual assets. While mutual funds have been able to diversify the risk of individual assets, they also expose investors to risk. In this article, we will see the parameters which are often used to evaluate the performance of mutual funds and hence help fund managers and investors assess the mutual fund risks associated with their investment.
Equityfriend – We are there for you
We provide sub broking and advisory services through ICICI Securities and if you need personal assistance and advisory in starting your investment journey (shares, mutual funds, gold, bonds, fixed deposit etc), please give us a call at 9506231006 or drop a mail at This email address is being protected from spambots. You need JavaScript enabled to view it. This email address is being protected from spambots. You need JavaScript enabled to view it. This email address is being protected from spambots. You need JavaScript enabled to view it.
Mean, as the name implies, shows the average return of the fund since its inception. Mean returns can be calculated as Arithmetic mean or geometric mean. The geometric mean is better suited to calculate the mean. Geometric mean is nothing but the CAGR.
Standard Deviation:
Standard deviation shows the volatility or probability of deviation from the mean return. Let’s understand this with an example. Suppose a mutual fund has given a mean return of 20% and has standard deviation of 10%. This means that the investor should expect to receive (68% of the time) a return anywhere between 10% and 30% (20%-10% to 20%+10%). The investor should also expect to receive (95% of the time) a return anywhere between 0% and 40% (20% — 2*10% to 20% + 2*10%).
Sharpe Ratio:
The Sharpe ratio is the ratio between excessive return of the fund over the risk free rate and standard deviation of the return of the fund. The risk is defined by the standard deviation. Hence a higher Sharpe ratio is preferable because it shows that for the same risk level, a higher Sharpe ratio means higher excessive returns.
Let’s do one example. Suppose a fund X has given an average return of 20% and the standard deviation is 10%. Another fund Y has given an average return of 16% with standard deviation of 6%. Assume that risk free rate is 8% (rate which you can get without any risk, like from banks or from PPF, Government securities etc.).
The sharpe ratio for fund X will be (20 – 8) / 10 = 1.2
The sharpe ratio for fund Y will be (16 – 8) / 6 = 1.33
Naturally, fund Y is better despite the fact that its average return is lower. This is also known as excessive return per unit of risk.
Beta measures the market risk of the fund. Every fund (or any asset) exposes investors to two types of risk. One is risk induced because of the nature of the asset. The other is because of the nature of the economy or market. For example, when the market crashed in 2008, stocks with sound business and strong fundamentals also crashed. Beta measures this part of the risk.
For example; if beta of a mutual fund is 0.8, this means that when the market changes by 1%, value of this fund will change by 0.8%. The change is market value of the fund will also come from above average performance of the companies which are part of the portfolio. However, beta doesn’t capture that.
Treynor Ratio:
Treynor ratio is very similar to Sharpe ratio. However, there is one difference. Treynor ratio measures excessive returns over the market risk unlike Sharpe ratio which measure excessive returns over total risk (standard deviation). The market risk is measured by beta. Here too, a higher Treynor ratio is preferable.
Take the above example. Assume that the beta of fund X and the beta of fund Y are 1.1 and 0.8 respectively.
The sharpe ratio for fund X will be (20 – 8) / 1.1 = 10.91
The sharpe ratio for fund Y will be (16 – 8) / 0.8 = 10
Naturally, fund X is better in this case because it had higher excessive return per unit of market risk.
Sortino ratio is another way to measure excessive returns per unit of “downside” risk. The downside risk is standard deviation of all returns which are below risk free returns. The formula is similar to Sharpe ratio. The only difference is that the standard deviation in sharpe’s ratio includes all returns while the standard deviation in Sortino ratio includes only those returns which are below risk free rate.
For example, suppose the “downside” standard deviation of fund X and fund Y in the example above are 8% and 5% respectively.
The Sortino ratio for fund X will be (20 – 8) / 8 = 1.5
The sharpe ratio for fund Y will be (16 – 8) / 5 = 1.6
Naturally, fund Y is better in this case because it had higher excessive return per unit of downside standard deviation.
Correlation:
Correlation, in simple words, defines how two set of assets are correlated. In mutual fund parlance, this shows how the fund is correlated to the market. The value is given in %. Hence correlation coefficient will be between 100% (or 1) and -100% (or -1). 1 shows strong positive correlation while -1 shows negative correlation and 0 shows that there is no correlation.
For example, if a mutual fund has correlation coefficient of 0.88 with the Nifty, the fund will do very good when the Nifty moves up.
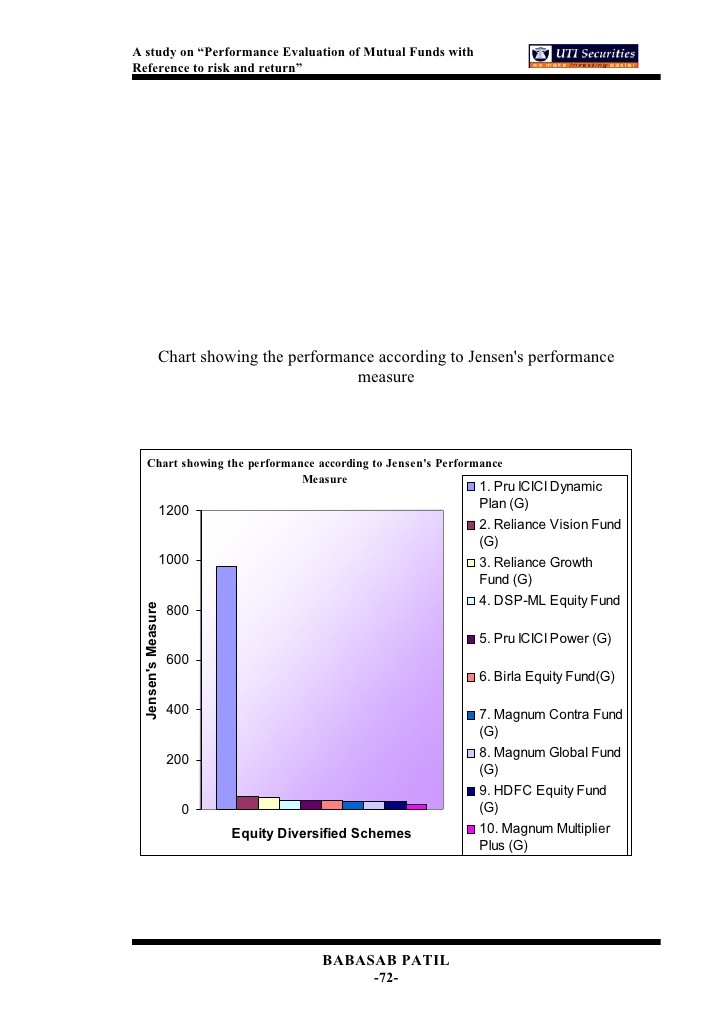
Jensen Model
Jensen model measures the returns given by mutual fund over and above the required rate of return. The difference is called Jensen’s alpha. The required rate of return is calculated by the CAPM model.
Required rate of return = Risk free rate + Beta*(market return — risk free rate).

Subtract this with the actual return given by the fund. The resultant value is alpha. Needless to say, higher alpha is preferable.
For example, in the cases of fund X and Y defined above; let’s find out the required rate of return. Assuming the market rate of return is 17% (long term sensex or nifty returns).
Required rate of return of fund X = 8 + (1.1*(17 – 8)) = 17.9%
Required rate of return of fund Y = 8 + (0.8*(17 – 8)) = 15.2%
Alpha of fund X = Actual mean return by fund X – required rate of return for fund X = 20 – 17.9 = 2.1%
Alpha of fund Y = Actual mean return by fund Y – required rate of return for fund Y = 16 – 15.2 = 0.8%
Naturally fund X is better as it has beaten the required rate by a big margin.
Fama model also measures the excessive returns over the required return. However, it calculates required rate of return in a different way. The difference between the actual return and required return is known as net selectivity.
The required rate of return = risk free rate + (n*(market return – risk free return))
Where n = standard deviation of the fund / standard deviation of market
Let’s calculate net selectivity for funds X and Y. Assume that standard deviation of market is 9%.
Required rate of return of fund X = 8 + ((10/9)*(17 – 8)) = 18%
Required rate of return of fund Y = 8 + ((6/9)*(17 – 8)) = 14%
Net Selectivity of fund X = Actual mean return by fund X – required return by fund X = 20 – 18 = 2%
Net Selectivity of fund Y = Actual mean return by fund Y – required return by fund Y = 16 – 14 = 2%
In this case, fund X and Y are equally attractive.
Investors can get more information on mutual fund investment risks from amphi website ( www. amfi india.com ).


