A 401k Must Read Mutual Fund Expense Ratio Myth Busted
Post on: 9 Июнь, 2015 No Comment

O ne of the most pervasive myths in the investing universe – and one that impacts the world of 401k plan sponsors and investors the most – states that “lower expense ratio mutual funds perform better than higher expense ratio mutual funds.” Like all absolute statements, this one is grounded in a partial, but by no means universal, truth. It gained national media attention when an August 2010 Morningstar study “How Expense Ratios and Star Ratings Predict Success ” concluded lower expense ratio funds did better at predicting mutual fund success than Morningstar’s star rating system. The study went as far as to say, “In every single time period and data point tested, low-cost funds beat high-cost funds.”
That’s a pretty strong statement, but is it true? It’s not clear Morningstar still seems to think so. As recently as last year, at its June 2011 Investors Conference, Laura Lutton, editorial director at Morningstar Inc. said, “cheaper funds are far more likely to outperform.” (“Morningstar exec Laura Lutton: Stick with cheaper funds ,” Investment News, June 8, 2012). There’s a reason why scientific researchers like to use hedging language such as “far more likely” rather than absolutist assertions like “in every single time period” – it’s too easy to knock the absolutist off its pedestal.
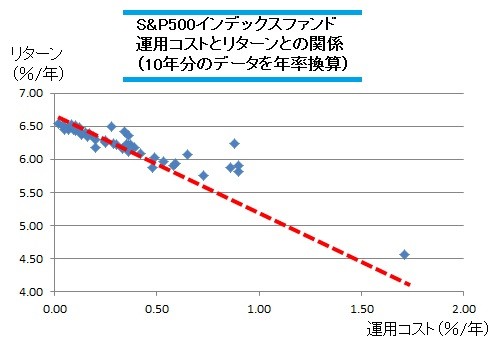
We took a look at the August 31, 2012 Morningstar data disk and ran a screen for all index funds with a best fit benchmark of the S&P 500, that were true no-load funds, that weren’t feeder funds, that had no short positions and that had either a “growth” or “growth and income” objective. This produced 50 funds (well, actually 51, but one was a “bear” fund meant to perform opposite of the S&P 500 and we eliminated it). We ran several different scatter graphs like these two and they all looked the same:
In both cases, the scatter graph appears as we would expect. The implied regression line (the dotted red line) is slopping downward, indicating a negative correlation between the expense ratio (on the x-axis) and the total return (on the y-axis). Indeed, the correlation in both sample sets is -0.92. In a situation where lower fees would always mean higher returns, the correlation would be -1.00. This is pretty close, but, as you can see, there are several data points showing cases where higher expense ratios correspond to higher returns. Still, while not supporting the August 2010 Morningstar study’s “every single case” language, these results are consistent with Lutton’s “far more likely” comment. This makes perfect sense. An index fund, particularly S&P 500 index funds like we’re looking at here, all have the same portfolio producing the same baseline performance. The only real difference in actual returns of different funds should be due to different expense ratios.
Unfortunately for this theory, however, the universe of active funds proves not a happy place. Using the same base Morningstar data disk, we ran the same screen, changing only the requirement that the fund be an index fund to the requirement that the fund not be an index fund. This produced 110 candidates (again, after removing a “bear market” fund). As you can see, the resulting scatter graphs look nothing like the index fund graphs above.
In the case of these actively managed funds, the scatter graphs show plenty of examples where higher expense ratio (x-axis) funds produced better performance (y-axis) – the exact opposite conclusion of the August 2010 Morningstar Study. Indeed, the correlation of the Annual 2011 Returns was much less (-0.18) while the correlation was actually positive for the 10 year data (+0.16). This positive correlation may be an artifact of survivor bias, but that doesn’t remove the fact that some high expense ratio funds earned higher performance numbers than their less expensive counterparts.
What are we to conclude? While expense ratios may be important when conducting due diligence on index funds, they may be less important – and even misleading – on actively managed funds. As we said in last week’s article (“What’s a Fair Fee to Pay a Fiduciary ,” FiduciaryNews.com. October 2, 2012), “it would not be unusual to find a high expense ratio actively managed fund with better investment returns than a low expense ratio actively managed fund.”
And regulators echo this sentiment. The SEC doesn’t say to stick to low expense ratio funds, it merely (correctly) points out, “As you might expect, fees and expenses vary from fund to fund. A fund with high costs must perform better than a low-cost fund to generate the same returns for you. ” Along the same lines, the DOL also stipulates fees should only represent part of an overall analysis of the appropriateness of an investment.
Alas, limiting ourselves to the written word, we cannot bust this particular myth with the fanfare of brilliant (and loud) pyrotechnics, but the results are nonetheless the same for every alert fiduciary: as your eyes can plainly see from the actual data presented in the scatter graphs, this myth is busted.
Interested in learning more about this and other important topics confronting 401k fiduciaries? Explore Mr. Carosa’s new book 401(k) Fiduciary Solutions and discover how to solve those hidden traps that often pop up in 401k plans.
3A%2F%2F0.gravatar.com%2Favatar%2Fad516503a11cd5ca435acc9bb6523536%3Fs%3D96&r=G /%


