Why the Dow Jones Record High Doesn’t Matter
Post on: 21 Сентябрь, 2015 No Comment

Written on 07 March 2013 by Murray Dawes
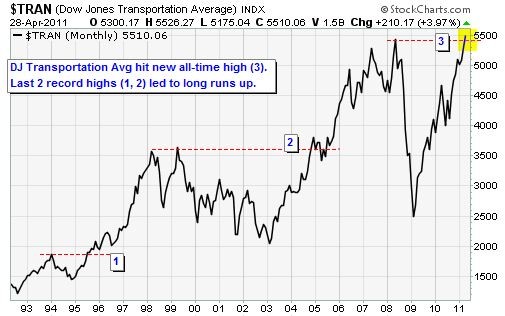
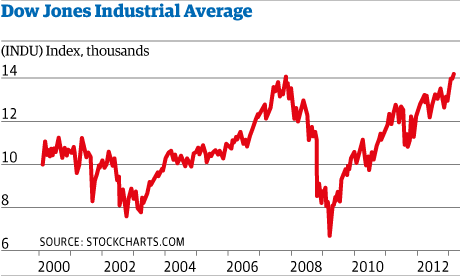
The story of the moment is the Dow Jones breaking out to a new all-time high. It certainly makes a nice headline, but does it really mean anything?
The first point to understand is that the Dow Jones is a price weighted index. Rather than relying on the changing market cap of a company to calculate the movements, the index uses the changing price instead.
This means that a higher priced stock (eg. 3M Co. share price USD$104, market cap USD$72 billion) will have more influence over movements in the index than a smaller priced stock (eg. Microsoft: share price $28, market cap USD$237 billion).
This obviously doesnt make much sense because there is no relation between the price of a stock and its market cap.
Also there are only 30 stocks in the index, so its not a broad reflection of the overall health of the market. For example if Apple [NASDAQ: AAPL] was in the index there is no way that the Dow Jones would be hitting all-time highs, because Apple is currently down 38% from its all-time highs set last year.
But having said that there is no doubt the money printing is currently working wonders on the US equity markets. The S&P 500 is also only a skip and a jump from its all-time high.
Im sure Im not the only one who thought it would be impossible for the market to retest all-time highs so soon after the market crash.
US Federal Reserve chairman Ben Bernanke always said he wanted to get stock prices up so that the wealth effect would kick in and help heal the US economy. He has certainly succeeded in stoking prices higher, but has he succeeded in getting consumers to open their wallets? Not really, and heres why
The last US GDP figures were actually negative in the US and unemployment remains stubbornly high.
A Bleak Picture Behind the Headlines
The Wall Street Journal even noted yesterday that 50,000 people slept each night in New York Citys homeless shelters, which is a record. In the article Mary Brosnahan, president of the coalition for the homeless said that, New York is facing a homeless crisis worse than any time since the Great Depression.
So it looks like Bernankes printed dollars arent filtering down to the masses as he told us they would. What a surprise.
Legendary hedge fund trader Stanley Druckenmiller said on CNBC the other day that the party in stocks may continue for a while longer and he doesnt know when it will end but my guess is its going to end very badly .
A great comparison recently on ZeroHedge.com between now and the Dows previous all-time high in 2007 paints a very bleak picture:
- Dow Jones Industrial Average: Then 14164.5; Now 14164.5
- Regular Gas Price: Then $2.75; Now $3.73
- GDP Growth: Then +2.5%; Now +1.6%
- Americans Unemployed (in Labor Force): Then 6.7 million; Now 13.2 million
- Americans On Food Stamps: Then 26.9 million; Now 47.69 million
- Size of Feds Balance Sheet: Then $0.89 trillion; Now $3.01 trillion
- US Debt as a Percentage of GDP: Then
38%; Now 74.2%

Theres not much about the comparison above that fills me with confidence that this breakout to new highs is sustainable.
When the upside momentum is as strong as it is currently it can be nearly impossible to imagine the stock market selling off at all. People who have missed out on the rally will be chasing the market higher and higher, adding fuel to the fire.
Most of the bears will have given up trying to short the market long ago. And so, breaking out to new highs can inspire a new set of investors to make the leap into the market hoping for even higher prices.
The Risk Lies This Way
Ill keep hammering home the view that the highest likelihood from here is that we see a false break of the highs and a sharp correction in prices.
The topping process can take weeks and even months to play out while the market whips traders out of positions. But I feel very confident that the risk is heavily to the downside over the next month or so.
You probably know the old saying of, Sell in May and go away, but the fact is the selling has arrived in April over the last few years.
The chart below shows the S+P 500 over the last three years
S&P 500 Daily Chart
Source: Slipstream Trader
Ive placed vertical lines in the chart around mid-April of each year. Its quite clear there has been a multi-month sell-off after April in each year.


