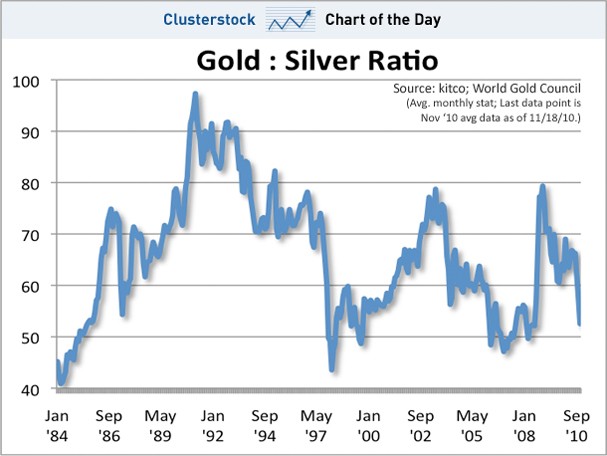
Understanding the Gold to Silver Ratio
Post on: 24 Июль, 2015 No Comment

You may or may not have noticed the two new Gold Ratio Charts on the
homepage. they are the Gold to Silver Ratio and the Dow to Gold Ratio charts.
This page will address the Gold to Silver ratio, while it’s sister page explains, in depth, the Dow to Gold Ratio .
This section of the guide was created to help you read the Gold to
Silver Ratio Chart and know how it can help you in your future
But before we start to understand how to read the Gold to Silver
ratio, we need to see it’s history.
History of the Gold to Silver Ratio
Displayed in the chart (above ) is the history of the ratio between
gold and silver as in relation to their market price. Also indicated
on the chart, at its beginning and end, are the two metals ratio to
the amounts found in earth’s crust and the ratio of the metals
currently mined.
According to the U.S. Geological Survey, silver is about 17.5 times
more abundant than gold in the earth’s crust.
Silver has been used as a form of money through out monetary history.
In the late 1100’s, newly discovered silver mines and better mining technology (for the times) was introduced to Europe and there was a virtual Silver Rush.
The new rush of money in Europe allowed many countries to become more centralized, which allowed them to expand their societies and replace the feudal system that had existed.
From the 12th century to the early 18th century, silver traded roughly at or near the 12. 1 ratio with gold.
In the 16th century, after the Spanish discovered large deposits of silver ore in South and Central America, a Silver Standard was created. Much like a Gold Standard, silver coins played the role of an international trading currency for almost four hundred years.
Then in 1717, to help England with their own fiat money troubles of the time, Sir Isaac Newton, who was Master of the Royal Mint, introduced a
fixed ratio between gold and silver to 15½. 1. This was also the first attempt, in recorded history, to replace the Silver Standard with a Gold Standard.
In 1832, before Andrew Jackson’s re-election bid for President, he vetoed legislation that would continue the charter for the Second Bank of the United States (central bank).
Jackson (pictured right) campaigned against the need for a U.S. central bank, he was afraid that the large central bank would be manipulated by private bankers.
He also argued this manipulation would allow the bankers and foreign interests to easily take advantage of the US’s financial system.
His veto also placed Congress back in control of the nations money supply, as written in the US Constitution.
After he won re-election on this platform, he signed the Coinage Act of 1834 into law. The Act changed the gold/silver ratio, by a half an ounce, to 16:1, valuing gold at $20.67 a troy ounce. This slight change in the ratio can be viewed in the chart below.
In 1873, when President Ulysses S. Grant signed the Coinage Act of 1873, it officially ended the Silver Standard. The United States embraced the Gold Standard and demonetized silver, labeled by those who wanted to keep silver monetized the Crime of 1873.
The result of the Coinage Act of 1873, was silver would no longer be
fixed to the price of gold. It became a free-floating commodity
which has since sent it’s ratio with gold to swing to many ups and
downs, as seen below.
Variables in the Gold to Silver Ratio
The ratio between gold and silver is determined by the relationship
between their current individual prices. However the two precious
The demand for gold is mostly used for investments and jewellery, silver
on the other hand is used more for industrial purposes, than investment purposes.
Furthermore, most of the gold mined throughout history still exists today, whereas silver is used immediately and processed once taken out of the mines and refined. These variables in supply may one day in the future cause silver’s price to spike if there is a shortage, causing the ratio to rapidly fall.
In addition, even-though silver’s price usually tracks in the same direction of gold, meaning when gold’s price goes up, so does the price of silver and vice-versa.
But this isn’t always the case, as seen in the chart below.
chart provided courtesy of TradingView.com
In late 2008, when the credit crisis was taking place, silver price plummeted, whereas gold went lower but not relative to silver in percentage terms. Plus, gold’s price recovered faster than the price of silver.
The credit crisis of 2008 gave the market the very real perception
that the industrial market would lose its strength. And since silver
is seen by those in the market as more of an industrial metal than an
investment metal, it too fell in price.
During this time the gold to silver ratio went up close to 70. (as
seen in the chart below) For those who invest in silver, this would
not have been the time to sell silver, but it would have been when to
buy.
How you use this tool is up to you, everyone has their own preferences as to when to get in, hold or get out of any market.
To use this tool of judging the ratio between gold and silver, the individual investor needs to understand how these precious metals behave in the markets as a whole.
But when you look at silver’s price, when its dollar price is adjusted for inflation, the price of silver has a lot higher to go in relation to its January, 1980 peak.


