Trading Forex With Confluence and Price Action » Learn To Trade
Post on: 22 Июль, 2015 No Comment

Trading Forex With Confluence and Price Action Signals
If I had to boil down my Forex trading strategy into to one simple phrase, it would be this; trading simple price action signals from confluent levels in the market.
In this trading training lesson, I am going to explain how to increase the probability of a price action signal by trading it from a confluent level in the market. So, lets begin by defining the two trading tools we will be discussing today:
Price action: Price action is the movement of the price of a market over a specific period of time. By learning to read the price action of a market, we can determine a market’s directional bias as well as trade from reoccurring price patterns or price action setups that reflect changes or continuations in market sentiment.
Confluence: A point in the market where two or more levels intersect each other, thus forming a hot point or confluent point in the market. In the dictionary, confluence means a coming together of people or things; concourse. So, basically, when we look for confluent areas in the market we are looking for areas where two or more levels or analysis tools are intersecting.
Examples of factors of confluence that I look for in the markets:
• An uptrend or a down trend; essentially a trend is one factor of confluence in and of itself.
• Exponential moving averages; I use the 8 and 21 day EMAs on the daily charts to help with trend identification and dynamic support and resistance identification. Both the 8 and 21 EMAs are factors or levels that can add confluence to a price action setup.
• Static (horizontal) support and resistance levels. These are the classic horizontal support and resistance levels that typically connect highs to highs or lows to lows. Heres a video on drawing support and resistance levels .
• Event areas. Event areas are levels in the market where a significant price action event occurred. This can be a strong directional movement after a price action signal forms, or it can simply be a rejection of a level followed by a strong directional movementsome significant event needs to have occurred at a certain point in the market, we can then consider this an event area or level. Read more on event areas here .
• 50% retrace levels. I personally watch the 50% to 61.8% retrace levels for another factor of confluence. I dont get into all the other Fibonacci extension levels as I think they are too discretionary and haphazard to be of any use. Its common knowledge that most major moves in the markets tend to retrace approximately 50% at some point after they form. But all the other Fibonacci levels are simply a case of if you put enough levels on your charts some of them are bound to get hit, in other words they are more messy and confusing than relevant or practical.
The 5 factors of confluence above are just some of the levels that can intersect to form a confluent area in the market, there are also intra-day levels and other factors of confluence that we can watch for, which I discuss in my price action trading course .
How to incorporate levels of confluence with price action signals
When I am analyzing the markets, I am primarily looking for an obvious price action trading strategy that has formed at a confluent point in the market. Of course, learning what constitutes on obvious or high-probability price action setup and a confluent point in the market is the result off education and screen time, but they really do not take long to learn. Once you spot a high-probability price action signal you can then begin to do some analysis of the market structure and the context that the signal has formed within. Check for the factors of confluence listed above and see if two or more of them line up with the price action signal, if so, you just might have a trade worth risking your money on.
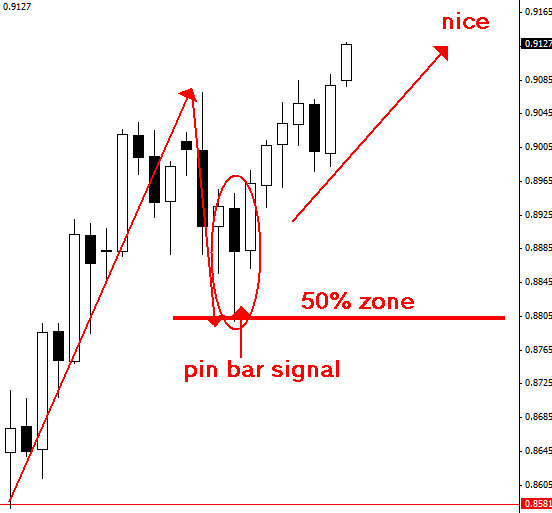
Heres an example of an obvious pin bar setup on the daily chart EURUSD that had 4 factors of confluence supporting it:
1: This pin bar had confluence with the dominant downtrend, as it formed telling you to sell the market with the trend.
2: The pin bar showed clear and forceful rejection of the daily 8 / 21 EMA dynamic resistance layer.
3: The pin bar was also rejecting a horizontal level of resistance.
4: The pin bar showed clear and forceful rejection of the 50% retrace of the last down move.

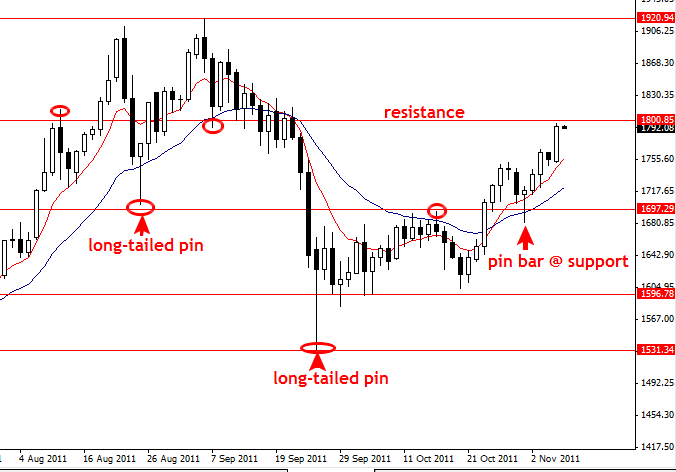
In the next example, we can see a pin bar setup on the daily spot Gold chart that had all 5 of the factors of confluence mentioned above:
1: This pin bar had confluence with the recently formed uptrend, as it formed telling you to buy the market with the trend.
2: The pin bar showed clear and forceful rejection of the daily 8 / 21 EMA dynamic support layer.
3: The pin bar was also rejecting a horizontal level of support.
4: The pin bar showed clear and forceful rejection of the 50% retrace of the last up move.
5: The pin bar formed off a well-defined event area that had formed recently.
From the examples above, you should have gained a basic knowledge of what trading price action from confluent levels in the market is all about. This lesson has given you a little glimpse into my core trading philosophy; looking for confluent levels in the market to trade obvious price action signals from. If you want to learn more about how I trade clean and effective price action strategies from confluent levels in the market, check out my price action trading course here .


