Top Down Strategy for ETFs
Post on: 16 Март, 2015 No Comment

Your e-mail has been sent.
When day trading was in vogue in the late 1990s, traders were obsessed with finding the magic bullet that would give them the highest possible level of accuracy in their daily trading decisions. Bollinger bands, oscillators, and the moving average convergence divergence (MACD) are just a sampling of the numerous indicators that traders used, and still use, in their quest for accuracy. Unfortunately, most traders and investors eventually discover that using too many types of technical analysis leads to a bad case of “analysis paralysis.” Rather than simply putting on positions that have a chance of profitable results, they spend all their time analyzing tickers for the perfect setup. This leads to unprofitable inactivity. The most profitable systems of technical analysis are also the most basic and efficient. The top-down strategy detailed below is based on simple indicators such as price, volume, trend lines, relative strength, and support/resistance levels. Further, these indicators are applied in a logical, easy-to-follow order.
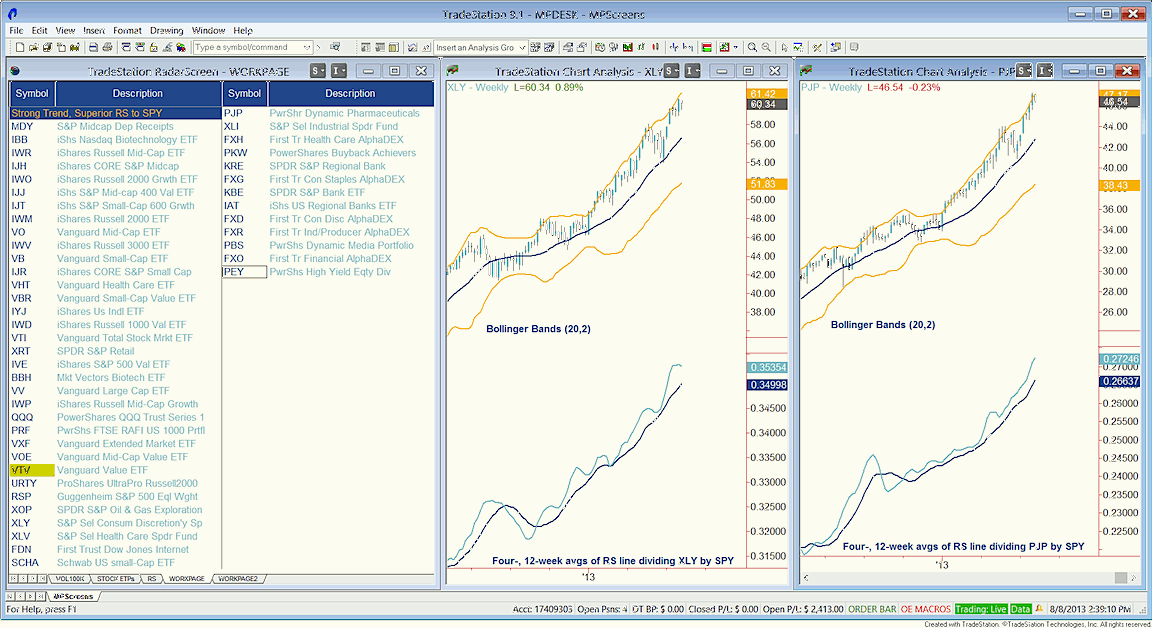
The following is a basic summary of the top-down strategy for selecting ETFs. The relative simplicity of this logical process is illustrated in Exhibit 1 .
Step 1. Determine the direction of the broad market trend.
- If the major indexes are trending steadily higher, nearly any type of ETF with relative strength can be traded.
- If the major indexes are in a steady downtrend, seek out any ETFs with relative weakness.
- If the major indexes are range-bound, avoid trading in broad-based ETFs that track the major indexes.
Step 2. Find the individual indexes with the most relative strength or weakness (divergence) compared to the major indexes.
- Compare the charts of industry sector and specialty ETFs with the S&P 500 or the Nasdaq Composite Index.
- Consider buying ETFs in the sectors with the most relative strength if the market is uptrending overall.

- Consider selling short ETFs in the sectors with the most relative weakness if the market is downtrending overall.
Step 3: Compare all the ETF families within the specific index to find the individual ETF with the most strength (or weakness) relative to the corresponding index.
- Again, overlay charts of each ETF family with the corresponding sector index.
- Ensure the ETF is also showing relative strength (or weakness) to itself, closing in the upper 30 percent (or bottom 30 percent) of its intraday range every day.
- Monitor changes in volume to confirm institutional buying interest.
Step 4. Select the resulting long or short ETF position now most likely to outperform the market.
- Use the top-down trading strategy to
- Find the ideal entry points
- Exit with maximum profitability or minimal loss
Step 5. Find the proper timing for a new position entry in the ETF most likely to outperform the stock market.
- Use strategies to locate ideal technical entry and exit points for new ETF trades.
- Know how to manage overnight gaps in your positions.
- Trail stops based on trendlines and other technical indicators for maximum profitability and conservation of profits.


