The Canadian Loonie
Post on: 15 Апрель, 2015 No Comment

12 September 2011
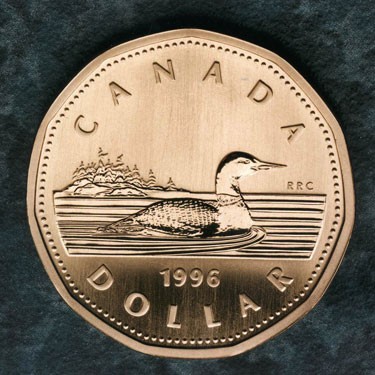
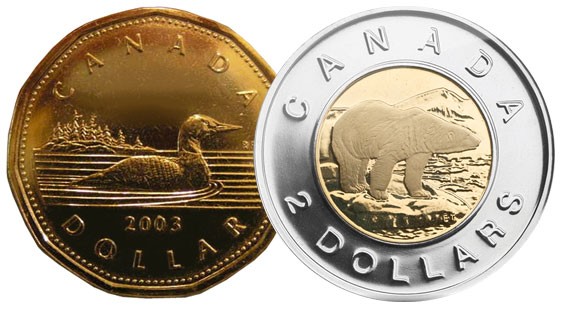
The loon, an aquatic bird that looks like a cross between a duck, a goose and a seagull, frequents lakes and ponds in the Canadian north. It also sits on one side of the Canadian Dollar coin, affectionately know as the Loonie. A profile of Queen Elisabeth II is featured on the other side of the coin.
A slight modification of the dollar’s nickname from the Loonie to the Lunatic might better reflect the random and unpredictable path of the Canadian currency vs. the US dollar (henceforth referred to as CAD or the Loonie).
Currency traders often employ technical methods that include chart patterns, momentum and stochastic indicators in an attempt to capture FX trends or meanreverting prices. The seemingly random and chaotic lunatic if you wish movement of CAD makes it one of the more difficult currency pairs to trade with traditional methods of technical analysis. Indeed, a study using 20 years of CAD daily closes was unable to discover a momentum system that generated a positive net return over the long-term.
Economic Releases are Just Noise
The latest employment, growth and manufacturing announcements cause CAD to fluctuate on a very short-term basis, but they have little lasting effect on the currency pair. You are just as likely to make money as lose when trading off economic announcements.
When Statistics Canada announced May 2011 Consumer Price Inflation, which exceeded the estimates of all 24 economists surveyed by Bloomberg, commentators were quick to forecast higher interest rates and a strengthening of CAD. But a quick check of 20 years of data shows a negative correlation between the currency and 2-year Canadian minus US interest rate differentials.
CAD is often defined as a risk-on currency. Whenever GDP rises, Greek worries abate, US industrial production rises, stocks soar or commodities advance, the market expects CAD to benefit. CAD increased in value when the European Monetary Commission said Greece would be able to get funds from both the EU and the IMF, despite common knowledge that Greece will eventually default. Once again, a short-term news item with no lasting impact distracted traders from what really mattered.
It’s all about Commodities
A study of correlations suggests that 75% of the Canadian dollar’s price movement can be explained by a broadly based basket of commodities. It is a commodity currency in the truest sense.
Canada exports commodities (energy, mineral, agricultural, and forestry products) and imports finished goods (machinery, equipment, automobiles and other consumer goods). The merchandise trade balance hovers around zero (exports equal imports) according to Statistics Canada, and one can easily see how rapidly fluctuating commodity prices can impact the demand and supply for Canadian dollars.
Correlation
When technical analysis fails, traders often search for correlated (and ideally trending) assets to help with their trading and forecasting decisions. If CAD walks randomly and is therefore unpredictable, a closely correlated asset with a better trend might offer clues to the future path of CAD. Crude oil, a significant Canadian export, is highly correlated to the Loonie and many in the market have based Canadian dollar hedging and trading decisions on their expectations for the price of crude oil. (Ignore for the moment that forecasting the price of Crude oil is not necessarily easier than forecasting CAD)
The correlation of crude oil to CAD over the past 10 years is + 0.52, much higher than the correlation of gold to CAD at + 0.33. The 2- year CADUSD interest rate differential is slightly negatively correlated and the BDIY (Dry Bulk Index) that rose to prominence as a forecaster of global growth during the market panic of 2008 lost its predictive ability and has been negatively correlated to CAD over the past year.

A Broadly-Based Commodity Index
Two commodity indices are highly correlated to CAD and a blend of them results in an even higher correlation. The CRB Raw Commodities Index (+ 0.62 correlation) includes many industrial commodities that are either not listed on an exchange or are too illiquid for the trading world to get involved with. Their prices are subject to less speculation and tend to reflect real industrial commodity demand and supply. The Thomson Reuters/Jefferies CRB Commodity Index (+ 0.59 correlation) of actively traded futures contracts is the more volatile of the two indices.
A blend of these two commodity indices, 65% CRB RIND and 35% TR/J CRB, results in a + 0.65 correlation to CAD/USD over the past 10 years and a + 0.76 correlation over the past 5 years A simple chart overlay shows that the commodity blend index is a very close fit to CAD.
But the best discovery is that the blended commodity index trends well. CAD price deviations away from trend are large enough to prevent the success of most trend-following methodologies. Some strategies will work in the short-term, but few will stand the test of time.
Conclusion
Don’t try to catch a Canadian dollar trend with momentum indicators. Over time, it is a losing proposition. The fluctuations around trend are simply too extreme. But trading CAD based on the technical signals from a much smoother trending and highly correlated commodity index has promise.
A long term investor or hedger would be well advised to ignore the daily release of economic data and trade CAD with commodity prices in mind. A day-trader, on the other hand, should use whatever works, and that may involve a different currency pair.


