The Basics Of Bollinger Bands
Post on: 16 Март, 2015 No Comment

In the 1980s, John Bollinger, a long-time technician of the markets, developed the technique of using a moving average with two trading bands above and below it. Unlike a percentage calculation from a normal moving average, Bollinger Bands® simply add and subtract a standard deviation calculation.
Standard deviation is a mathematical formula that measures volatility. showing how the stock price can vary from its true value. By measuring price volatility, Bollinger Bands® adjust themselves to market conditions. This is what makes them so handy for traders: they can find almost all of the price data needed between the two bands. Read on to find out how this indicator works, and how you can apply it to your trading.(For more on volatility, see Tips For Investors In Volatile Markets .)
What’s a Bollinger Band®?
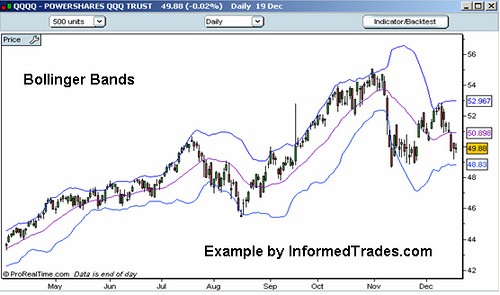
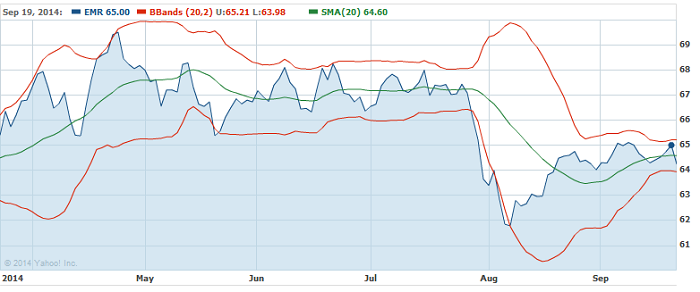
Bollinger Bands® consist of a center line and two price channels (bands) above and below it. The center line is an exponential moving average ; the price channels are the standard deviations of the stock being studied. The bands will expand and contract as the price action of an issue becomes volatile (expansion) or becomes bound into a tight trading pattern (contraction). (Learn about the difference between simple and exponential moving averages by checking out Moving Averages: What Are They? )
A stock may trade for long periods in a trend. albeit with some volatility from time to time. To better see the trend, traders use the moving average to filter the price action. This way, traders can gather important information about how the market is trading. For example, after a sharp rise or fall in the trend, the market may consolidate. trading in a narrow fashion and criss-crossing above and below the moving average. To better monitor this behavior, traders use the price channels, which encompass the trading activity around the trend.

We know that markets trade erratically on a daily basis even though they are still trading in an uptrend or downtrend. Technicians use moving averages with support and resistance lines to anticipate the price action of a stock. Upper resistance and lower support lines are first drawn and then extrapolated to form channels within which the trader expects prices to be contained. Some traders draw straight lines connecting either tops or bottoms of prices to identify the upper or lower price extremes, respectively, and then add parallel lines to define the channel within which the prices should move. As long as prices do not move out of this channel, the trader can be reasonably confident that prices are moving as expected.
When stock prices continually touch the upper Bollinger Band®, the prices are thought to be overbought ; conversely, when they continually touch the lower band, prices are thought to be oversold. triggering a buy signal.
When using Bollinger Bands®, designate the upper and lower bands as price targets. If the price deflects off the lower band and crosses above the 20-day average (the middle line), the upper band comes to represent the upper price target. In a strong uptrend, prices usually fluctuate between the upper band and the 20-day moving average. When that happens, a crossing below the 20-day moving average warns of a trend reversal to the downside. (For more about gauging an asset’s direction and profiting from it, see Track Stock Prices With Trendlines .)


