Technical Analysis of the Gold Market
Post on: 3 Август, 2015 No Comment

The market view for gold has varied substantially this past year. This shift in the market view has also led to substantial volatility in the price of gold. Coming in at the lows of December 2011, gold was approximately $1,525 per ounce, rising in late February to just short of $1,800. That kind of volatility in a short period of time can be quite unsettling for gold investors.
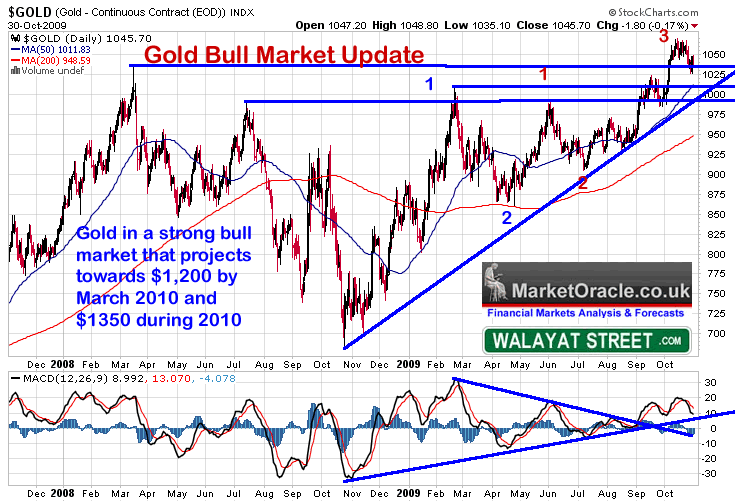
Several important points are evident in the charts for gold that indicate a dramatic shift in the market view by investors. First was a break of the downtrend in late July, which was then successfully tested in early August. Essentially, the market view has shifted from bearish, in which any rally was used to sell into, to a bullish bias, in which any pullback in gold is being used as a buying opportunity.
Chart courtesy of www.StockCharts.com
This bullish market view is also evident in larger volumes on up days, as well as higher highs and lows. The next test was the 200-day moving average (MA), which was also successfully breached and subsequently held. Over the short term, the market view on gold might be slightly overextended as the Relative Strength Index (RSI) is indicating such a possibility and some profit-taking might ensue.
Chart courtesy of www.StockCharts.com

For a longer-term market view of gold, I put up a three-year weekly chart. This removes a lot of the noise that’s prevalent in a chart that covers a shorter period of time. Following the highs in 2011, gold has seen a neutral to downward market view. Many rallies were used as opportunities for investors to sell their holdings of gold.
This market view, however, has just shifted as gold broke through its resistance line. This now opens up the possibility of a retest of the high just above $1,900 per ounce. Also note that the market view regarding an overbought condition is not evident in the RSI for this weekly chart. This means that, while a pullback in gold over the short term might be possible, over the long term, this move being overextended is not yet a worry.
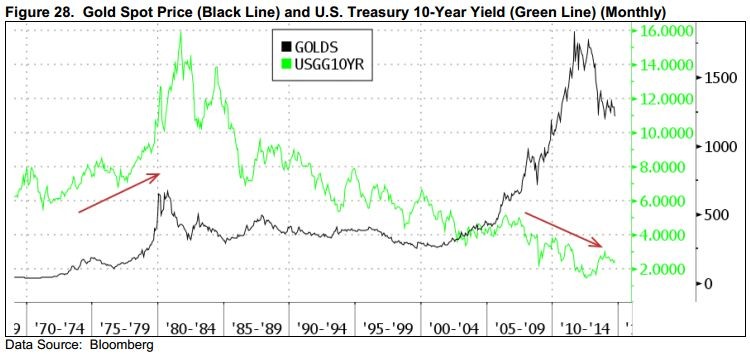
The market view of gold is extremely dependent on central bank activity. With the Federal Reserve just days away from possibly enacting additional monetary stimulus, it might be possible that the current move in gold has already priced in the market view of any new policy initiatives. This might coincide with a “buy on the rumor, sell on the fact” trade. However, the weekly chart of gold does show more upside potential if the market view remains bullish following this week’s Federal Reserve announcement.


