Stock Chart Continuation Patterns Triangles and Channels
Post on: 8 Июль, 2016 No Comment

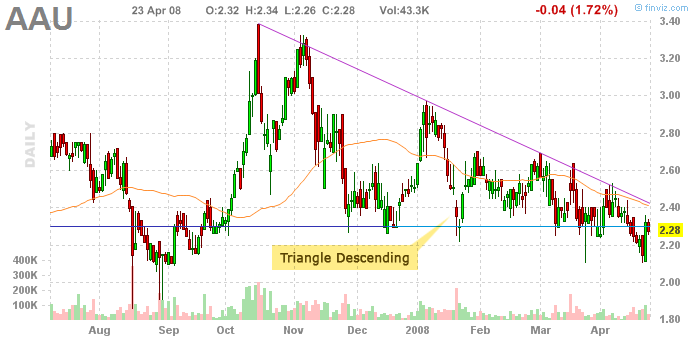
T he previous post had looked at some continuation stock chart patterns. This week well touch upon more patterns that can be identified in stock charts. Please note that the screen shots may not perfectly reflect the definition of that pattern, which a trader performing technical analysis would look for and accept and only meant to provide some visual idea instead of mere text (click on images for enlarged views). Here are more continuation type patterns (continued).
Triangle Chart Patterns
Triangle patterns are continuation patterns that are identified by narrowing price movements. Adding trend lines to the chart helps to recognize such patterns, which can be ascending, descending, or symmetrical triangles.
Ascending Triangle Pattern
The ascending triangle continuation pattern is seen during a stock upswing. It is marked by a horizontal line at the top offering resistance to the price movement and a rising trend line at the bottom. The breakout from the resting area (or period) is an indication that the uptrend will continue. The volume may shrink during the resting phase and expand during the breakout, which is an indication that bullish traders are moving in to buy the stock .
Descending Triangle Pattern
The descending triangle continuation pattern is seen during a stock downswing. It is marked by a horizontal line at the bottom offering support to the price movement and a falling trend line at the top. The breakout from the resting period is a signal that the downtrend will continue. The volume may shrink during the resting phase and expand during the breakout, which is an indication that bearish traders are moving in to sell their shares .
Symmetrical Triangle Pattern
A symmetrical triangle is a continuation pattern with converging trend lines. Generally, a breakout from the top signals a bullish trend, whereas a breakout from the bottom indicates a bearish trend, both accompanied by increasing volume of shares. Similar to ascending and descending triangle patterns, the symmetrical triangle pattern is another consolidation phase, which is a resting period before the stock continues its upswing or downswing.
Channeling
A channel is a trading range (phase) where there is a no clear trend to be identified, usually occurring after an obvious trend. There are three types of channels – rising, falling, or rectangle.
Rising Channel
A rising channel is a continuation pattern where a stock shows bullish signals with increasing prices along a channel marked by two parallel lines. Generally, such a channel can be seen during a downtrend that includes this minor rising channel, which is usually followed by a breakout from the lower end of the channel. The rising channel continues until the stock moves to break through the upper (bullish) or lower (bearish, ending the minor upswing) end of the channel with the breakout indicated by expanding volume.
Falling Channel
A falling channel is a continuation pattern where a stock shows bearish signals with decreasing prices along a channel marked by two parallel lines. Generally, such a channel can be seen during an uptrend that includes this minor falling channel, which is usually followed by a breakout from the upper end of the channel. The falling channel continues until the stock moves to break through the upper (bullish, ending the minor downtrend) or lower (bearish) end of the channel accompanied by high volume.
Rectangle Channel
A rectangle channel is a continuation pattern and can be seen as a consolidation phase after a clear trend. The upper end of the channel connects the high prices, while the lower end of the channel links the low prices to form a rectangle (the two lines indicate resistance and support respectively). High volume trades accompany the breakout, which occurs when either line is broken through; a breakout from the top is a bullish signal and a breakout from the bottom indicates a bearish trend.
Do you examine stock charts for patterns? Have you had reasonable success doing it over a period of time?
About the Author. Clark works in Saskatchewan and has been working to build his (DIY) investment portfolio, structured for an early retirement. He loves reading (and using the lessons learned) about personal finance, technology and minimalism. You can read his other articles here .


